


Abstract
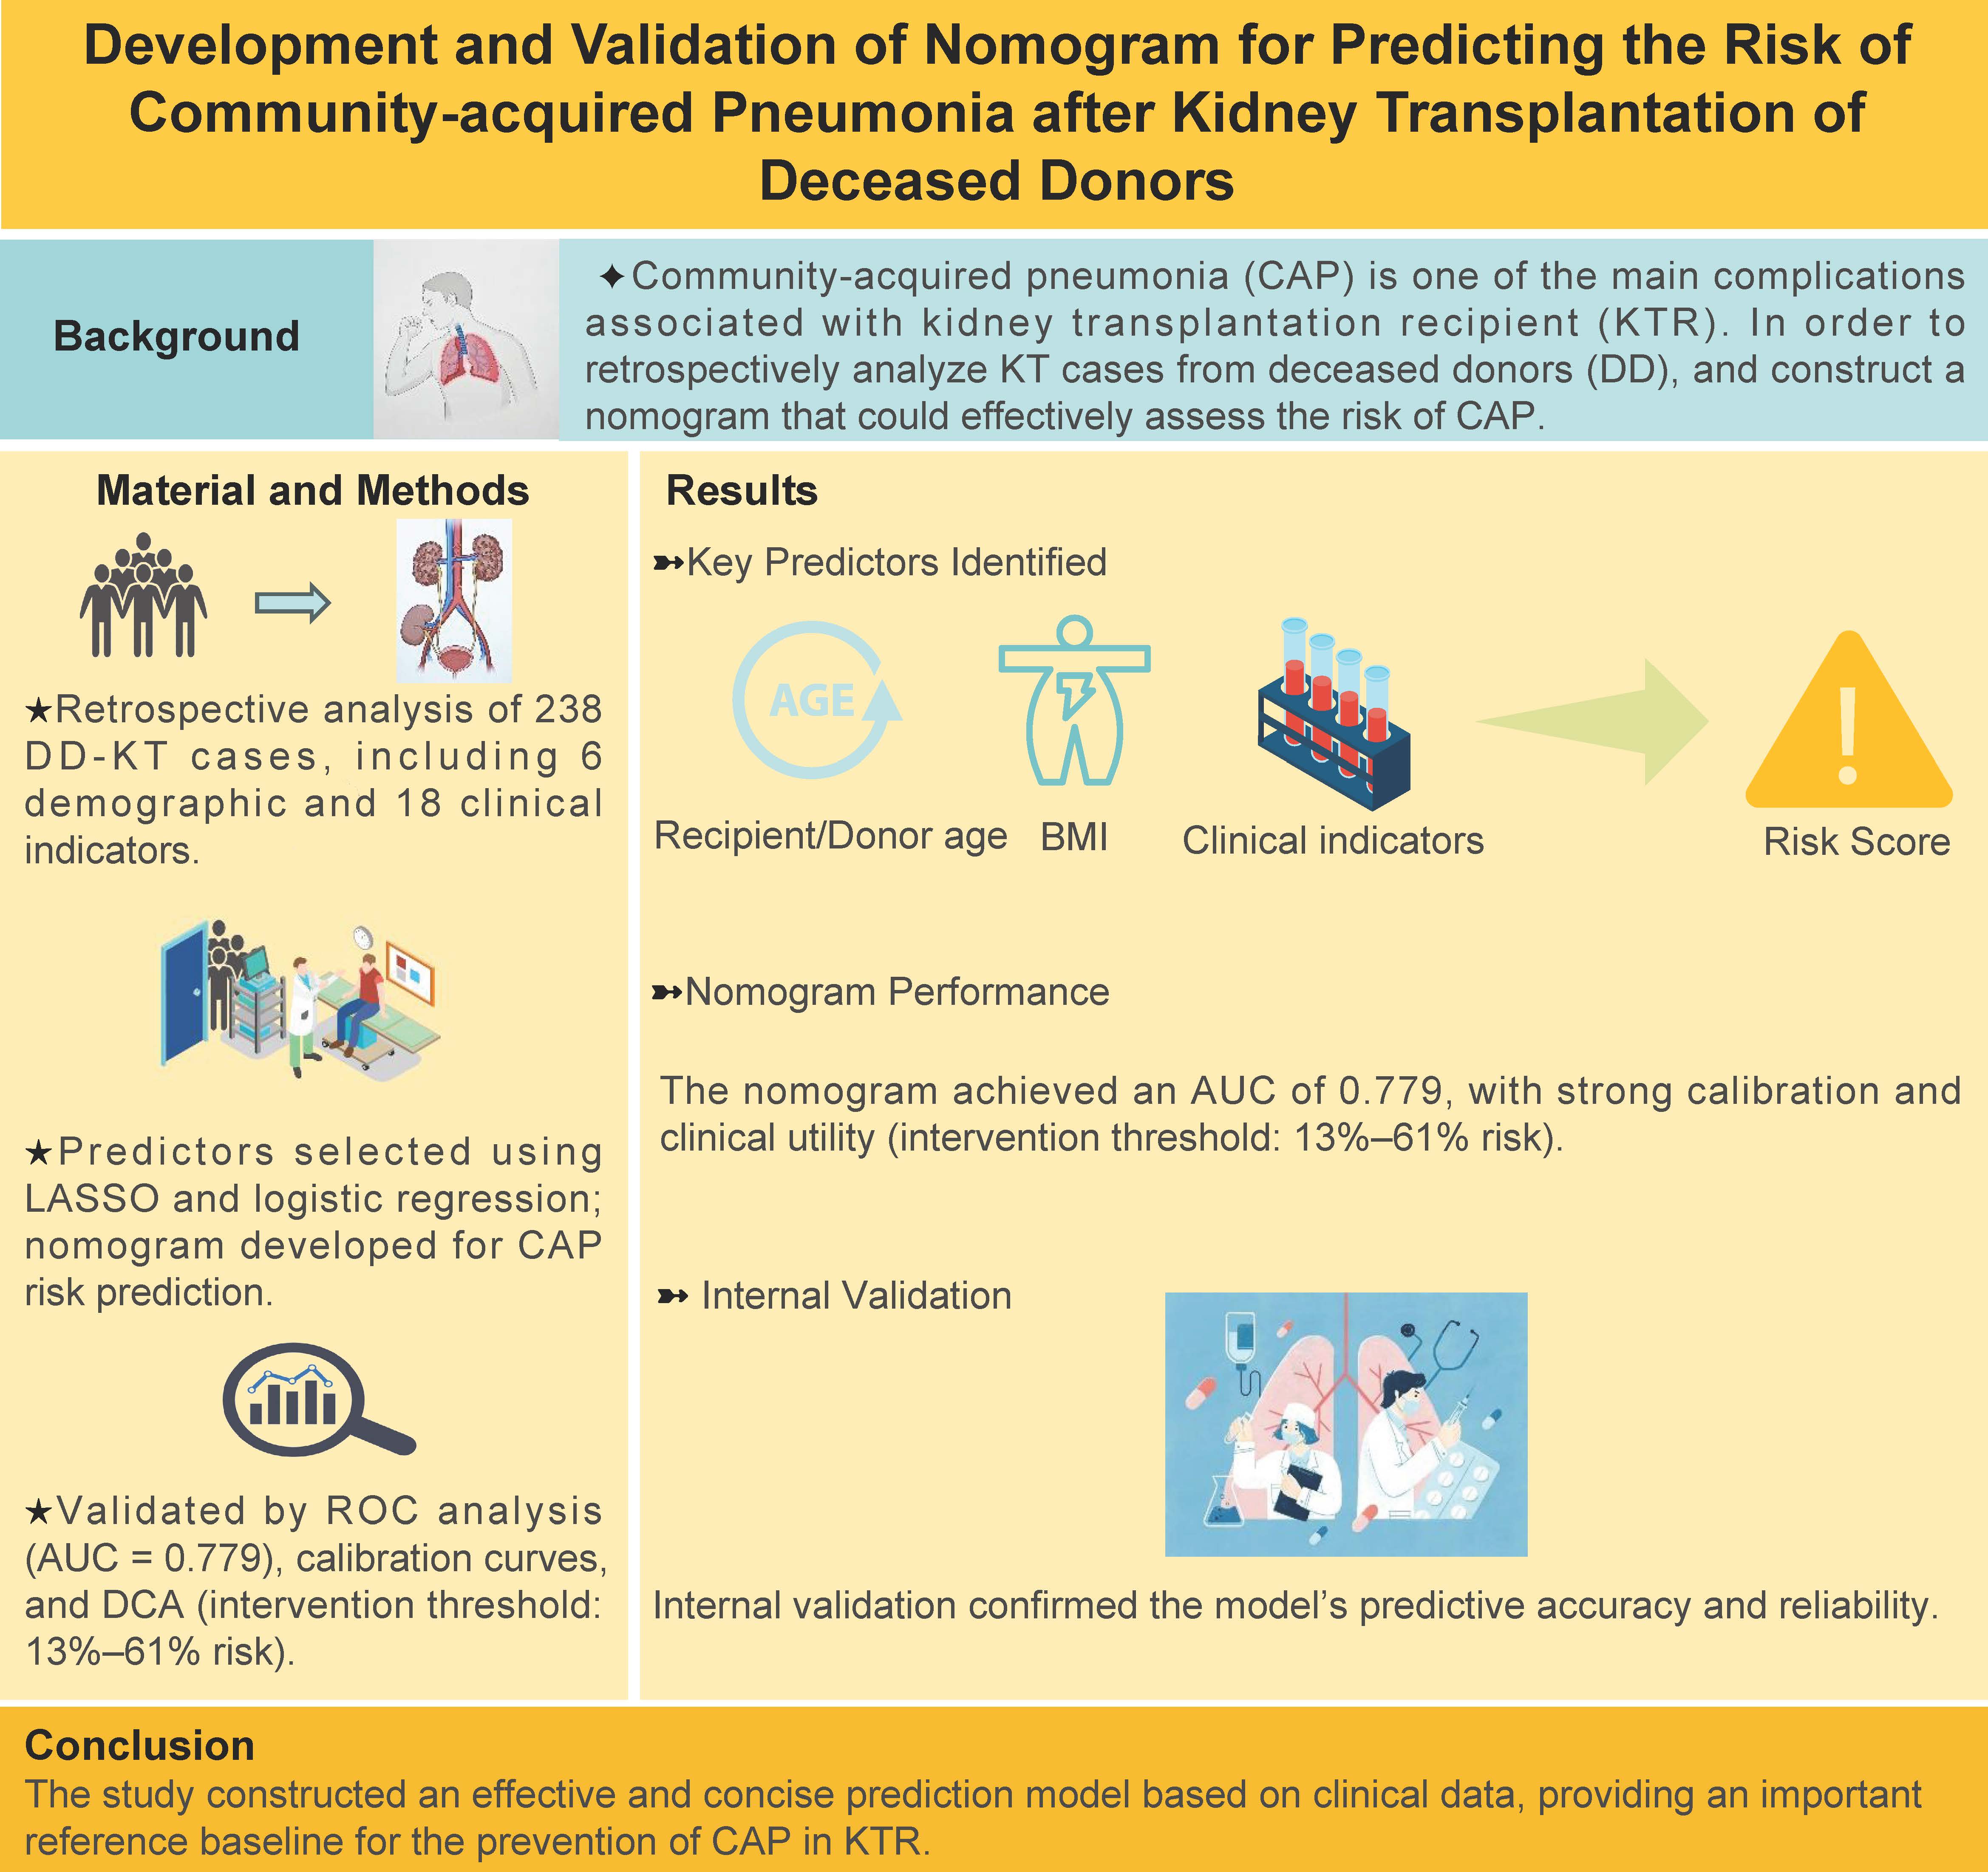 Background: Community-acquired pneumonia (CAP) is one of the main complications associated with kidney transplantation recipient (KTR). In order to retrospectively analyze KT cases from deceased donors (DD), and construct a nomogram that could effectively assess the risk of CAP.
Methods: We employed logistic regression and the least absolute shrinkage and selection operator (LASSO) to identify predictors from 238 cases collected at Department of Urology, The First Affiliated Hospital of Anhui Medical University, between January 1, 2018, and May 31, 2023. The dataset comprised 6 demographic and 18 clinical indicators, which were used for training and validation. A nomogram was constructed using these predictors, and its effectiveness was evaluated through receiver operating characteristic (ROC) analysis, calibration curves, and clinical decision analysis. Internal validation further confirmed the model's predictive accuracy.
Results: The predictive factors screened in terms of demographic data included recipient/donor age and body mass index. The clinical data screened eight predictors to obtain ‘RiskScore’. The Area under Curve value for the nomogram constructed using the aforementioned predictors was recorded to be 0.779. The calibration curve showed that the model exhibited better predictive performance. In particular, DCA showed that in cases where the probability for the prediction of CAP was 0.13–0.61, the clinical intervention was recommended. The internally verified data established a better predictive ability of the model.
Conclusion: The study constructed an effective and concise prediction model based on clinical data, providing an important reference baseline for the prevention of CAP in KTR.
Background: Community-acquired pneumonia (CAP) is one of the main complications associated with kidney transplantation recipient (KTR). In order to retrospectively analyze KT cases from deceased donors (DD), and construct a nomogram that could effectively assess the risk of CAP.
Methods: We employed logistic regression and the least absolute shrinkage and selection operator (LASSO) to identify predictors from 238 cases collected at Department of Urology, The First Affiliated Hospital of Anhui Medical University, between January 1, 2018, and May 31, 2023. The dataset comprised 6 demographic and 18 clinical indicators, which were used for training and validation. A nomogram was constructed using these predictors, and its effectiveness was evaluated through receiver operating characteristic (ROC) analysis, calibration curves, and clinical decision analysis. Internal validation further confirmed the model's predictive accuracy.
Results: The predictive factors screened in terms of demographic data included recipient/donor age and body mass index. The clinical data screened eight predictors to obtain ‘RiskScore’. The Area under Curve value for the nomogram constructed using the aforementioned predictors was recorded to be 0.779. The calibration curve showed that the model exhibited better predictive performance. In particular, DCA showed that in cases where the probability for the prediction of CAP was 0.13–0.61, the clinical intervention was recommended. The internally verified data established a better predictive ability of the model.
Conclusion: The study constructed an effective and concise prediction model based on clinical data, providing an important reference baseline for the prevention of CAP in KTR.
Keywords: deceased donor; kidney transplantation; community-acquired pneumonia; nomogram; risk predictor
Introduction
For end-stage renal disease (ESRD), kidney transplantation (KT) is the preferred choice of treatment[1] , primarily owing to its ability to improve survival and quality of life as compared to dialysis therapy[2,3] . In recent years, there has been a steady increase in the number of transplants in China. However, results for clinical studies showed that the postoperative effect of DD was worse as compared to live KT[4] , thereby presenting several challenges to postoperative clinical management. Among these, community-acquired pneumonia (CAP) is one the most common postoperative complication. Since the recipients are treated with immunosuppressive drugs following transplantation, for the entire life, the body's immune mechanism gets damaged. In fact, it is one of the main causes of death related to KT[5] . A large number of clinical studies previously reported several independent risk factors for postoperative CAP. In particular, to overcome the scarcity of kidney donor resources, several countries have successively expanded the criteria of donor age, however, this has also resulted in a significant increase in the probability of CAP[6] . Similarly, in a previous study conducted by Chen et al.[7] , the advanced age of the recipient was identified as an important risk factor for CAP. In addition to this, Flavouris et al. reported that recipients with a body mass index (BMI) > 25kg/m2 exhibited a significantly increased probability of postoperative infection and a shortened life span[8] . However, these risk factors were usually acquired after transplantation. In order to improve the quality of life for kidney transplant recipients and reduce the impact of diseases unrelated to the transplanted organ, such as CAP, it is imperative to develop a clinical model that can effectively predict CAP. By actively conducting research and collaborating with healthcare experts, our ultimate goal is to establish a robust clinical model that aids in forecasting CAP and effectively managing this vulnerability in the kidney transplant population. However, only a few studies have previously assessed the influence of preoperative clinical blood indexes of donors and recipients on the risk of CAP after surgery. The present study aimed to develop a nomogram that could effectively predict CAP based on preoperative demographic and clinical data (including both donors and recipients). Altogether, the findings of the study would assist the clinicians in the assessment of CAP risk in the recipients, and providing timely treatment.
Material and methods
Data collection and diagnostic criteria
The data on the recipients and their matched donors were collected from the Urology Kidney Transplant Ward of the First Affiliated Hospital of Anhui Medical University.. The recipient request was the first kidney transplant for organ donation after the death of a citizen. The operation time range is from January 1, 2018 to May 31, 2023. The data was collected through the inpatient system of the hospital and the Chinese Scientific Registry of Kidney Transplantation (CSRKT). The current study was approved by the Ethics Committee of the First Affiliated Hospital of Anhui Medical University. The database was divided into demographic data and clinical indicators of donors and recipients. Among them, donor-age (D-age), D-gender, D-BMI, recipient-age (R-age), R-gender, and R-BMI were included for 6 demographic variables. On the other hand, the clinical indicators included R-creatinine (R-Cr), R-alanine transaminase (R-ALT), R-aspartate transaminase (R-AST), R-recipient total bilirubin (R-TB), R-alkaline phosphatase (R-ALP), R-total protein (R-TP), R-Kalium (R-K+), R-Natrium (R-Na+), R-Chloride (R-Cl-), dialysis time (DT), length of hospital stay (LHS), warm ischemia time (WIT), cold ischemia time (CIT), D-Na+, D-K+, D-TB, D-urea, and D-albumin (D-ALB), totaling 18 clinical indicators.
CAP diagnostic criteria: We referred to the CAP diagnostic criteria established by China's Infection Group, Respiratory Diseases Branch of Chinese Medical Association, and The 2007 CAP Guidelines of the American Society of Infectious Diseases/American Thoracic Society[9,10] : ① The clinical symptoms included cough, sputum expectoration, and fever (fever was generally persistent or intermittent low- or high-fever and the renal function test was normal); clinical signs: signs of pulmonary consolidation or (and) damp rales in the lungs. ② Blood monitoring: Neutrophils, C-reactive protein, and pre-procalcitonin in the blood after transplantation served as the sensitive indicators to distinguish between bacterial and non-bacterial infections. ③ Imaging examination: Lung CT was mainly performed in our department. CAP showed new characteristic changes such as multifocal patchy infiltrating shadow, consolidation shadow of leaf or segment, ground-glass shadow, and irregular nodular shadow, with or without pleural effusion[11] . Pathogen detection: Oral, throat, sputum, and other sources specimens were regularly collected for cultivation for differential diagnosis. Plain CT scans formed the primary basis for the diagnosis of CAP. The appearance of ① or ② symptoms, together with the characteristic changes of ③ formed the basis for diagnosing CAP.
The follow-up endpoints were as follows: 1. The follow-up time was until June 30, 2023; 2. During the follow-up period, the endpoint of the observation was the loss of the graft or the death of the recipient.
Immunosuppressive regime
All patients received anti-thymocyte globulin as induction therapy and standard maintenance therapy. The postoperative immunosuppressive regimen involved prednisone acetate + mycophenolate mofetil (MMF) + tacrolimus. During KT and on the first and second days of surgery, 500 mg of methylprednisolone (BMI ≥50 kg) or 250 mg (BMI <50 kg) was used for pulse therapy, and, on the 3rd to 5th day of operation, 120, 80, and 40 mg were applied, respectively. Moreover, on the 6th day, the patient was changed to oral prednisone acetate (10 mg/day). Antithymocyte globulin (ATG) or basiliximab was not routinely used for immune induction. Oral MMF (1.0 g/day) was started on the first postoperative day, and tacrolimus (0.1 mg/kg/d) was routinely used on the second postoperative day. The usage was adjusted according to the blood concentration of MMF and controlling the area under the blood concentration-time curve of mycophenolic acid to 30-60 mg/h/L. The dosage was adjusted according to the trough value of the blood concentrations of tacrolimus; after 1, 2-3, 4-6, and after 6 months, the trough values of blood drug concentration were maintained at 10-15, 9-12, 7-10, and 4-8 ng/mL, respectively.
Statistical analyses
Statistical data analysis and visualization were performed using the R software (Version 4.0.3; https://www.R-project.org). The only exception was the Kaplan–Meier (K-M) curves (for mapping the survival of recipients after KT), which were created using the GraphPad Prism 8.0. In our analysis, the tables were prepared with Microsoft® Word 2019.
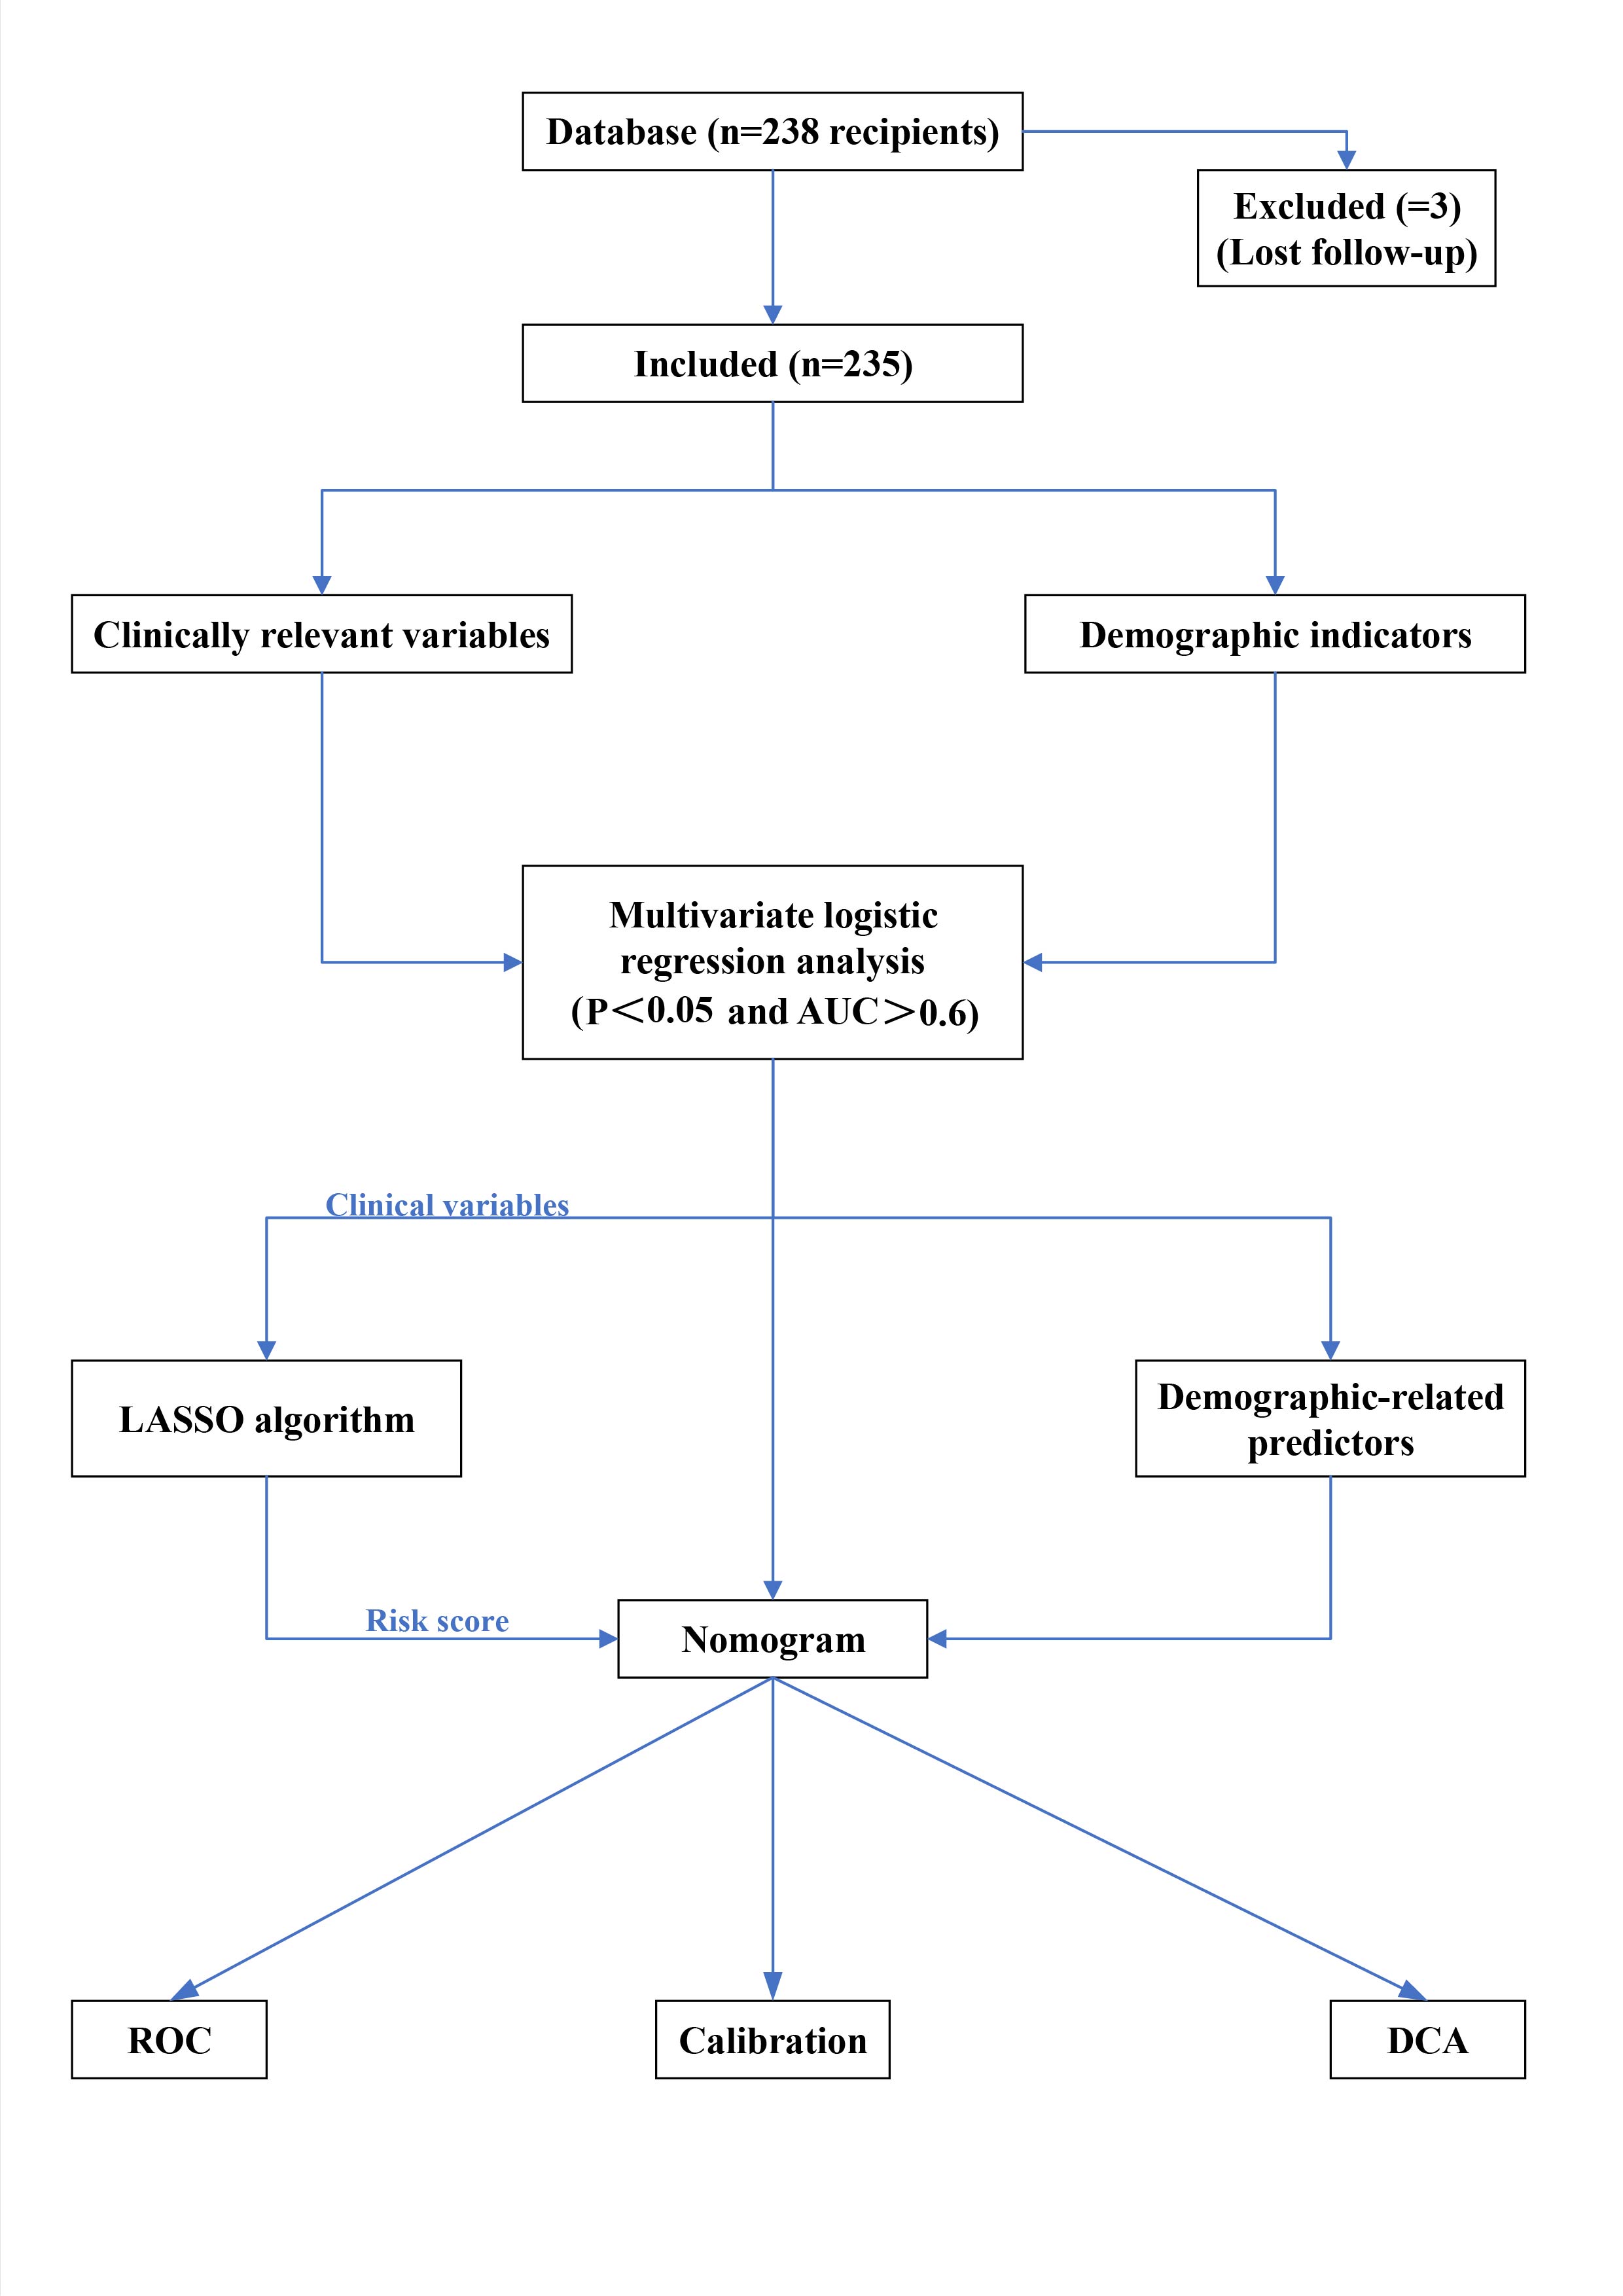
First, all collected data were continuous variables. The four variables donor age, BMI value, recipient age, and BMI value in the demographics were screened out for predictors with P < 0.05 through logistic regression analysis. Best-separation and logistic regression helped screen 18 clinical data points to determine the best cut-off value, P-value, odds ratio (OR), and area under the curve (AUC) under the receiver operating characteristic (ROC) curve; P < 0.05 were selected to convert these predictors into binary variables. Then, the variables selected from the clinical data were added to the least absolute shrinkage and selection operator (LASSO) algorithm to select the final predictor[12-14] . Then, the selected predictors in the clinical data were combined into the RiskScore (RiskScore was obtained by adding the coefficients of each predictor selected by the LASSO algorithm). Finally, the RiskScore and the selected demographic predictors were used to jointly construct a nomogram for predicting CAP. In terms of model verification, the AUC value under the ROC was used to verify the sensitivity and specificity of the nomogram. Although the model wasn't fully calibrated per the significance test, its clinical usefulness was considered through decision curve analysis (DCA) [15,16] . In addition, the CAP nomogram underwent bootstrapping verification (1,000 bootstrap resampling) to calculate the relative corrected AUC value. Each group was divided into a training group and a verification group at the ratio of 5:5. The 5:5 ratio for dividing the training and validation sets was intentionally chosen to ensure an equal distribution of data for both model development and evaluation. This approach allows for a more balanced assessment of the model's performance, particularly in smaller datasets, by providing sufficient data for both training and validation phases. Each group provides the AUC value, false-positive rate, and true positive rate, among others. The entire workflow is illustrated in Figure 1.
Figure 1. Flow chart of the prediction model of community-acquired pneumonia after KT from the deceased donors.
Results
The present study involved data collection from 238 recipients. However, three patients were excluded from the study owing to incomplete patient data and other reasons (e.g. loss to follow-up). Finally, 235 recipients and 141 matching donors were included in the study. Recipient male-to-female ratio was 165:70. Importantly, the average age of the recipients was recorded to be 41.5 ± 9.5 years. Among these, 88 patients were aged > 50 years (~37.4%), and 20 patients were aged > 55 years (~8.5%). In comparison to this, the ratio of male to female donors was 126:15, while the average age was 43.0 ± 16.7 years. Among these, 80 donors were aged > 50 years (~ 56.7%), and 23 donors were aged > 60 years (~ 16.3%). The number of patients with postoperative CAP was recorded to be 55 (CAP incidence was recorded as the first occurrence only), which accounted for ~23.4% of the total number of recipients. The data collected for the community-acquired pneumonia group and non-community-acquired pneumonia group is shown in Table 1.
Table 1. Basic demographic characteristics and the clinical data characteristics
|
Characteristics |
Non-CAP group (%) |
CAP group (%) |
Total |
P -value |
AUC |
|
|
n=180 |
n=55 |
n=235 |
|
|
|
Clinical data of recipient |
|
|
|
|
|
|
R-Cr(umol/L) |
|
|
|
0.004 |
0.640 |
|
>889.1 |
142(60.4) |
34(14.5) |
176(74.9) |
|
|
|
≤889.1 |
38(16.2) |
21(8.9) |
59(25.1) |
|
|
|
R-ALT(U/L) |
|
|
|
0.169 |
0.543 |
|
>28 |
59(25.1) |
24(10.2) |
83(35.3) |
|
|
|
≤28 |
121(51.5) |
31(13.2) |
152(64.7) |
|
|
|
R-AST(U/L) |
|
|
|
0.209 |
0.527 |
|
>17 |
92(39.1) |
32(13.6) |
124(52.8) |
|
|
|
≤17 |
88(37.4) |
23(9.8) |
111(47.2) |
|
|
|
R-TB(umol/L) |
|
|
|
0.004 |
0.609 |
|
>16.8 |
80(34.0) |
11(4.7) |
29(12.3) |
|
|
|
≤16.8 |
100(42.6) |
44(18.7) |
144(61.3) |
|
|
|
R-TP(g/L) |
|
|
|
0.100 |
0.546 |
|
>80.1 |
37(15.7) |
12(5.1) |
49(20.9) |
|
|
|
≤80.1 |
143(60.9) |
43(18.3) |
186(79.1) |
|
|
|
R-K(mmol/L) |
|
|
|
0.111 |
0.546 |
|
>4.86 |
85(36.2) |
29(12.3) |
63(26.8) |
|
|
|
≤4.86 |
95(40.4) |
26(11.1) |
78(33.2) |
|
|
|
R-Na(mmol/L) |
|
|
|
0.041 |
0.568 |
|
>141.9 |
60(25.5) |
9(3.8) |
69(29.4) |
|
|
|
≤141.9 |
120(51.1) |
46(19.6) |
166(70.6) |
|
|
|
R-Cl(mmol/L) |
|
|
|
0.010 |
0.547 |
|
>95.2 |
165(70.2) |
34(14.5) |
199(84.7) |
|
|
|
≤95.2 |
15(6.4) |
21(8.9) |
36(15.3) |
|
|
|
LHS (day) |
|
|
|
0.005 |
0.670 |
|
>24 |
78(33.2) |
36(15.3) |
104(44.3) |
|
|
|
≤24 |
102(43.4) |
19(8.1) |
121(51.5) |
|
|
|
DT (month) |
|
|
|
0.019 |
0.605 |
|
>38 |
88(37.4) |
33(14.0) |
121(51.5) |
|
|
|
≤38 |
92(39.1) |
22(9.4) |
114(48.5) |
|
|
|
R-ALP (umol/L) |
|
|
|
0.142 |
0.540 |
|
>76 |
129(54.9) |
32(13.6) |
161(68.5) |
|
|
|
≤76 |
51(21.7) |
23(9.8) |
74(31.5) |
|
|
|
Clinical data of donor |
|
|
|
|
|
|
D-Na(mmol/L) |
|
|
|
0.288 |
0.531 |
|
>145.1 |
64(27.2) |
12(5.1) |
76(32.3) |
|
|
|
≤145.1 |
116(49.4) |
43(18.3) |
159(67.7) |
|
|
|
D-K(mmol/L) |
|
|
|
0.004 |
0.545 |
|
>3.13 |
170(72.3) |
38(16.2) |
208(88.5) |
|
|
|
≤3.13 |
10(4.3) |
17(7.2) |
27(11.5) |
|
|
|
D-TB (umol/L) |
|
|
|
0.056 |
0.563 |
|
>9.9 |
79(33.6) |
10(4.3) |
89(37.9) |
|
|
|
≤9.9 |
101(43.0) |
45(19.1) |
146(6.8) |
|
|
|
D-urea (umol/L) |
|
|
|
0.024 |
0.593 |
|
>6.64 |
87(37.0) |
11(4.7) |
98(41.7) |
|
|
|
≤6.64 |
93(39.6) |
44(18.7) |
137(58.3) |
|
|
|
D-ALB (umol/L) |
|
|
|
0.099 |
0.569 |
|
>35.5 |
112(47.7) |
39(16.6) |
151(64.3) |
|
|
|
≤35.5 |
68(28.9) |
16(6.8) |
84(35.7) |
|
|
|
WIT (min) |
|
|
|
0.006 |
0.558 |
|
>19 |
10(4.3) |
9(3.8) |
19(8.1) |
|
|
|
≤19 |
170(72.3) |
46(19.6) |
216(91.9) |
|
|
|
CIT(h) |
|
|
|
0.420 |
0.526 |
|
>9 |
80(34.0) |
20(8.5) |
100(42.6) |
|
|
|
≤9 |
100(42.6) |
35(14.9) |
135(57.4) |
|
|
|
|
|
|
|
|
|
|
demographic data |
|
|
|
|
|
|
D-age(y) |
|
|
|
0.001 |
0.618 |
|
>47 |
87(37.0) |
41(17.4) |
128(54.5) |
|
|
|
≤47 |
93(39.6) |
14(6.0) |
107(45.5) |
|
|
|
D-BMI (kg/m2) |
|
|
|
0.031 |
0.521 |
|
>17.9 |
165(70.2) |
43(18.3) |
208(88.5) |
|
|
|
≤17.9 |
15(6.4) |
12(5.1) |
27(11.5) |
|
|
|
R-age(y) |
|
|
|
0.002 |
0.625 |
|
>46 |
72(30.6) |
33(14.0) |
105(44.7) |
|
|
|
≤46 |
108(46.0) |
22(9.4) |
130(55.3) |
|
|
|
R-BMI (kg/m2) |
|
|
|
0.013 |
0.604 |
|
>22.1 |
87(37.0) |
31(13.2) |
118(50.2) |
|
|
|
≤22.1 |
93(39.6) |
24(10.2) |
117(49.8) |
|
|
R-: recipient; D-: donor; Cr: creatinine; ALT: alanine aminotransferase; AST: aspartate transaminase; TB: total bilirubin; WIT: warm ischemia time; CIT: cold ischemia time; TP: total protein; K+: Kalium; Na+: sodium; Cl-: chloridion; LHS: length of hospital stay; DT; dialysis time; ALP: alkaline phosphatase; ALB: albumin.
This database identified the best cut-off value for clinical indicators through best‐separation and transformed it into a dichotomous variable. For P < 0.05, the study included R‐Cr, R‐TB, R‐Cl−, DT, LHS, WIT, D‐K+, D‐urea, and R‐Na+ as variables. The aforementioned variables were further obtained using the LASSO algorithm. This included R‐Cr, R‐TB, R‐Cl−, DT, LHS, WIT, D‐K+, and D‐urea. A total of eight variables fulfilled the conditions (excluding R‐Na+) (Figure 2A and 2B), and the nonzero coefficient, OR value, and 95% confidence interval of the predictor were obtained. The values for the same are shown in Table 2. These 8 predictor variables were further combined into a RiskScore. Finally, to the RiskScore, we added four demographic predictors (D‐age, R‐age, D‐BMI, and R‐BMI, which exhibited P < 0.05 in the logistic regression) to form a nomogram constructed to visually predict the CAP model (Figure 2C). In terms of internal verification, the ROC curve showed that the nomogram exhibited excellent predictive ability for CAP.
Figure 2. Feature selection of the clinical indicators using the LASSO binary regression model. (A) In the LASSO model, the best lambda parameter was selected using 5-fold cross-validation and minimal criteria. The curve of the partial likelihood deviance (binomial deviance) was plotted versus the logarithm of the lambda parameter. Dotted vertical lines were drawn at the optimal values using the minimum criteria and the I SE of the minimum criteria (I-SE criteria). (B) For 8 characteristics, the LASSO coefficient profiles were created. Each coefficient profile was displayed against the lambda parameter's logarithm. The vertical line was generated using 5-fold cross-validation at the selected value, where the best lambda value was generated in 8 features with nonzero coefficients. Abbreviation: SE: Standard Error. (C) The nomogram for predicting the occurrence of community-acquired pneumonia after KT from the deceased donors. The nomogram of community-acquired pneumonia after KT developed by cohort included Riskcore, D-age, R-age, D-BMI, and R-BMI. The RiskScore includes 8 clinical predictors of R-Cr, R-TB, R-Cl-, DT, LHS, WIT, D-K+, and D-urea.

Table 2. Morbidity of community-acquired pneumonia prediction factors after kidney transplantation from the deceased donors
|
Predictors |
β |
P-value |
OR (95%CI) |
|
Length of hospital stay |
0.840012333 |
0.005 |
3.268 (1.437-7.432) |
|
R-creatinine |
0.681181964 |
0.004 |
0.294 (0.129-0.669) |
|
R-TB |
-0.832945333 |
0.004 |
4.261 (1.588-11.435) |
|
R-Cl- |
0.66932031 |
0.01 |
0.298 (0.119-0.744) |
|
WIT |
-0.898453394 |
0.006 |
7.778 (1.826-33.124) |
|
D-K+ |
1.171816463 |
0.004 |
0.184 (0.058-0.578) |
|
D-urea |
-1.58720191 |
0.024 |
0.375 (0.160-0.881) |
|
Dialysis-time |
-0.770738912 |
0.019 |
2.767 (1.178-6.500) |
β, the regression coefficient; CI, confidence interval
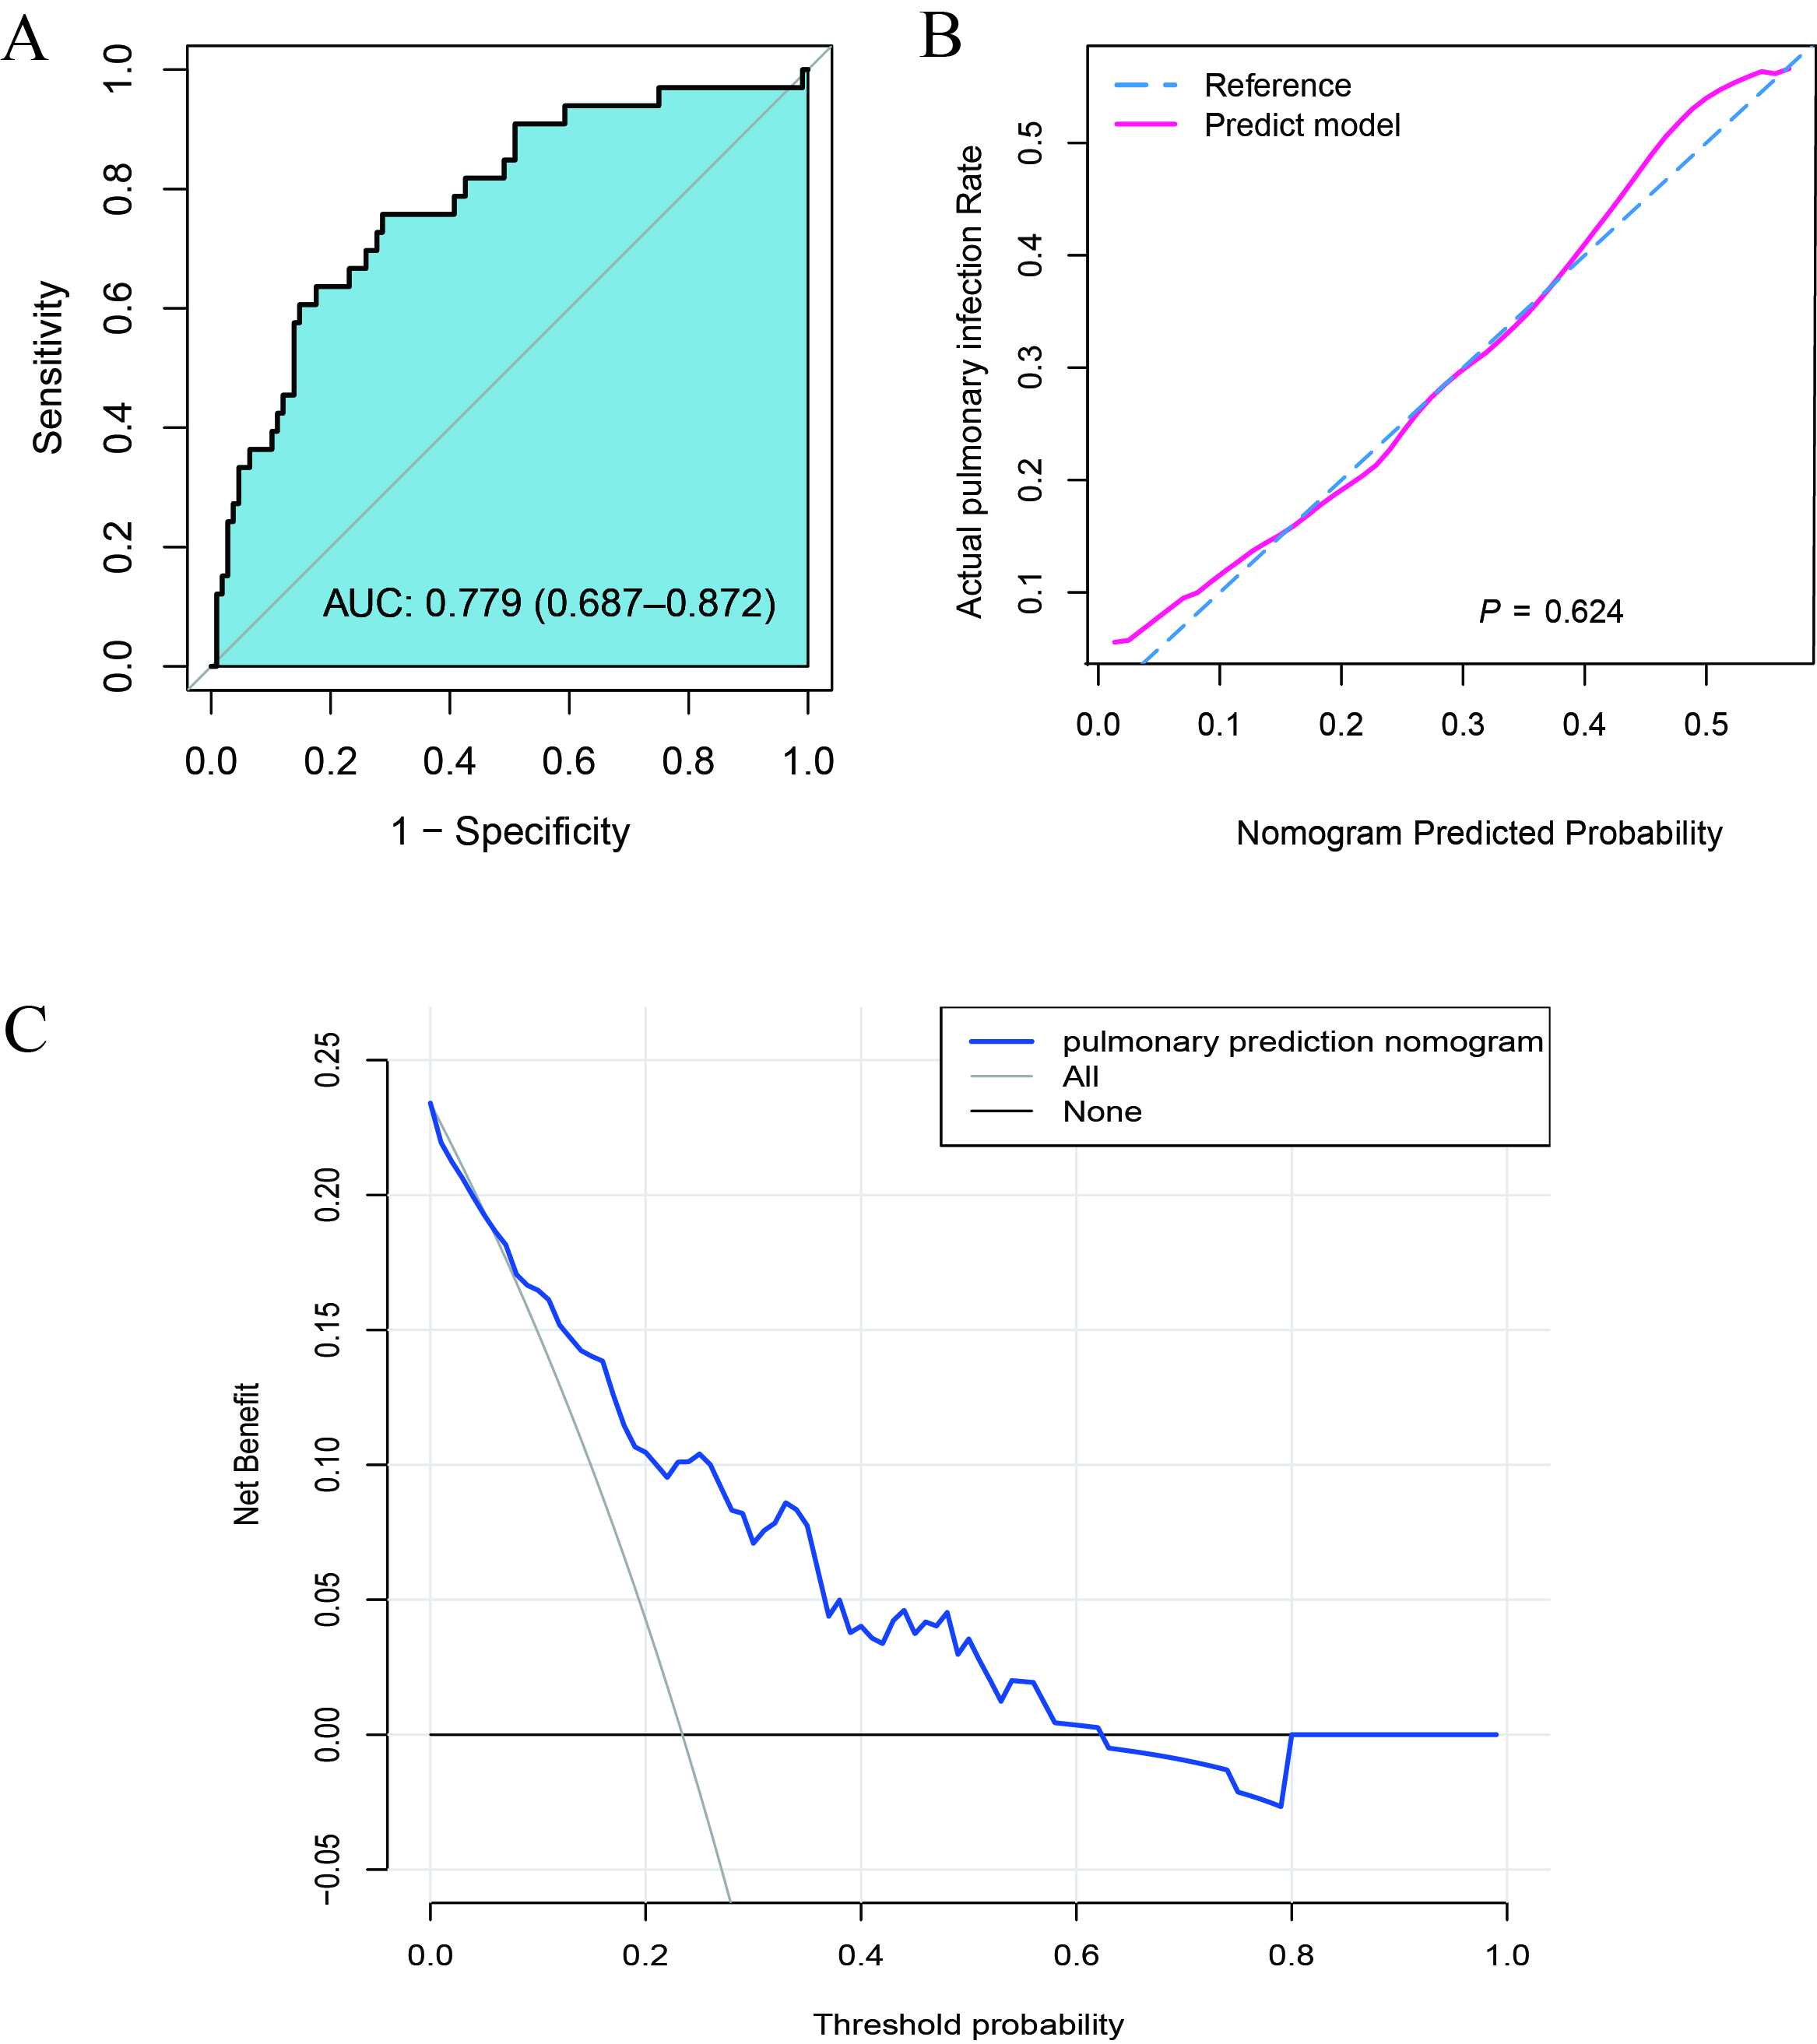
As shown in Figure 3A, the AUC value under ROC was 0.779 and 95% CI was 0.687–0.872. The calibration curve verification model is shown in Figure 3B (P=0.12 indicates good calibration). DCA showed that when the probability for prediction of CAP was in the range of 0.13–0.61, Within this range, the model yields a net benefit greater than both full intervention and no intervention strategies, the clinical intervention was recommended for the ESRD patients (Figure 3C).
Figure 3. Effectiveness evaluation of the nomogram model. (A) The receiver operating characteristic (ROC) curve of the nomogram of the risk prediction after transplantation. The X-axis and Y-axis reflect the false positive rate and true positive rate of post-transplant morbidity prediction. The AUC value was 0.779. (B) The calibration curve of the CAP-risk prediction nomogram after transplantation. After transplantation, the CAP prediction is represented on the X-axis, while the actual CAP is represented on the Y-axis. The perfect prediction result of the ideal model matches the diagonal dashed line. The nomogram performance is represented by a solid line, and a match closer to the diagonal dashed line indicates a better prediction. (C) For CAP after transplantation, decision curve analysis (DCA) was performed. The Y-axis represents the net income. The CAP risk nomogram after transplantation is indicated by a red line. The thin solid line represents the hypothesis that all recipients could survive after transplantation, while the thick solid line represents the hypothesis that all kidney recipients will suffer CAP after transplantation. The decision curve indicates that the threshold probabilities for patients and doctors are >0.13 and < 0.61, respectively. The current study results indicate that the morbidity risk nomogram could be used for post-KT morbidity risk prediction as it is more helpful than intervention-for-all-recipients or no-intervention schemes.
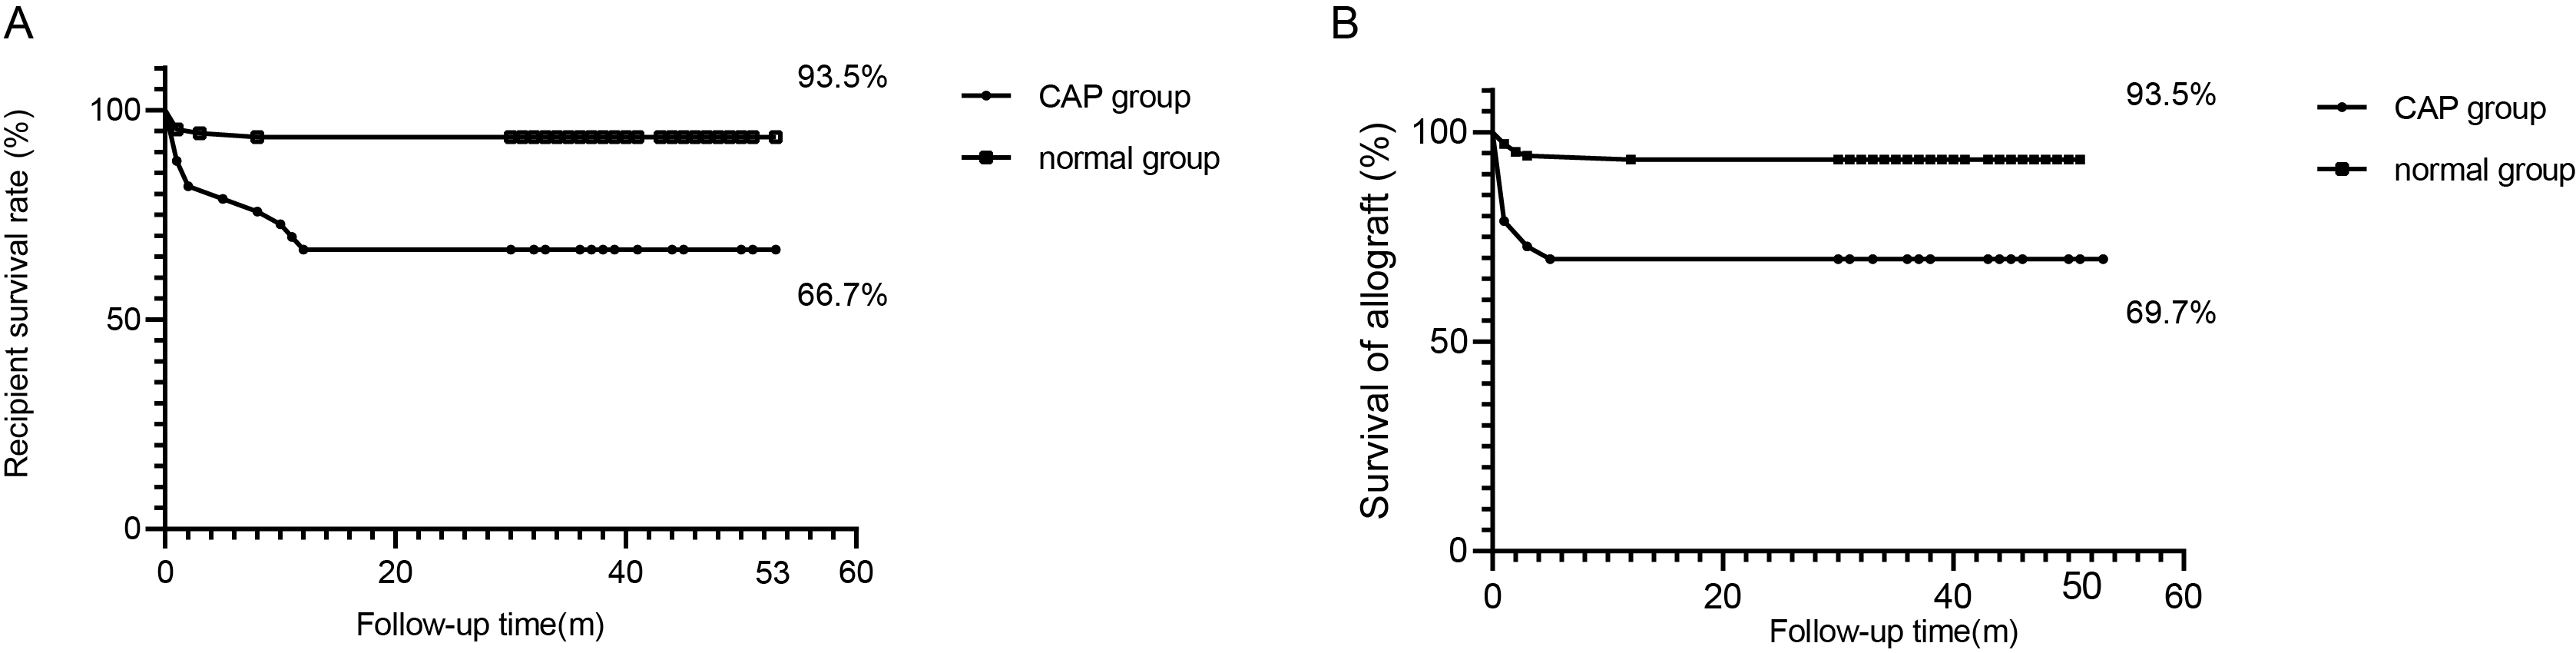
This further proved the excellent clinical effect of the model. To evaluate the universality of model performance, 10‐fold cross‐validation was performed on the models in the training queue, and good CAP prediction capabilities were achieved (Table 3).For 235 recipients included in the study, the average follow‐up time was 35.0 ± 14.0 months, wherein recipient death or kidney transplant failure acted as a follow‐up endpoint. The maximum follow‐up time was recorded to be 53 months. During the follow‐up period, 18 patients died, of which 11 experienced CAP. According to the statistical analysis, P-value was calculated to be < 0.001. In addition to this, 16 patients lost their transplanted kidneys, which included 10 patients from the CAP group (P = 0.0002). The risk of death in the CAP group was HR=2.5, 95% CI: 1.8–3.4. Overall, the life span or transplant kidney function of the recipients belonging to the CAP group was observed to be worse as compared to the non-community-acquired pneumonia group. The Kaplan–Meier (K–M) curve for survival status and function of the transplanted kidney after KT is shown in Figure 4A and 4B.
Table 3. Evaluation results of the model in 10 randomly selected independent subgroups
|
|
Training group |
Validation group |
||||
|
Groups |
AUC |
False positive rate |
True positive rate |
AUC |
False positive rate |
True positive rate |
|
1 |
0.820 |
0.554 |
1.000 |
0.765 |
0.846 |
0.706 |
|
2 |
0.881 |
0.877 |
0.867 |
0.784 |
0.549 |
0.944 |
|
3 |
0.797 |
0.800 |
0.765 |
0.796 |
0.755 |
0.750 |
|
4 |
0.799 |
0.852 |
0.667 |
0.777 |
0.852 |
0.667 |
|
5 |
0.783 |
0.765 |
0.714 |
0.766 |
0.877 |
0.583 |
|
6 |
0.922 |
0.831 |
0.923 |
0.690 |
0.531 |
0.850 |
|
7 |
0.821 |
0.714 |
0.812 |
0.769 |
0.692 |
0.824 |
|
8 |
0.723 |
0.620 |
0.818 |
0.920 |
0.724 |
1.000 |
|
9 |
0.744 |
0.741 |
0.714 |
0.815 |
0.840 |
0.684 |
|
10 |
0.762 |
0.755 |
0.737 |
0.884 |
0.655 |
1.000 |
|
AVG (M + 95%CI) |
0.805 (0.744-0.881) |
0.751 (0.620-0.852) |
0.802 (0.714-0.923) |
0.797 (0.765-0.884) |
0.732 (0.549-0.852) |
0.801 (0.667-1.000) |
A total of 235 patients were randomly assigned to the training group and the verification group at a ratio of 5:5.
Figure 4. (A) The K-M curve of recipient survival after kidney transplantation. (B) The K-M curve of transplanted kidney functions after kidney transplantation. ***P < 0.001
Discussion
Following the completion of KT in ESRD patients, the clinicians primarily focus on the reduction of postoperative complications and extension of life expectancy. In the case of extremely limited kidney donor pools, it is important to construct a model that could effectively predict postoperative CAP.
KT is often the first choice of treatment for patients with ESRD[17,18] . With China's organ transplantation field advancement and newer immunosuppressive drugs, KT success rate and patient lifespan have improved significantly. However, post-KT CAP presents a substantial challenge. This study used deceased donor KT data to create a nomogram predicting post-KT surgery CAP risk. The findings of the study would assist in the matching of donors' kidneys to ideal recipients. Additionally, it would assist surgeons in making clinical decisions. The study leveraged extensive clinical and demographic data to characterize CAP, after KT, from several different dimensions. Therefore, based on the logistics regression model, the LASSO algorithm was introduced to optimize the selection of features for the risk model, such that relatively unimportant variable coefficients became zero and were excluded from the model. This further ensured that optimal variables screened out from logistics regression were included in the nomogram.
The model used two aspects to construct model predictors. In particular, demographic variables screened out four predictors of D‐age, R‐age, D‐BMI, and R‐BMI. In comparison to this, eight predictors were screened out of clinical indicators, namely R‐Cr, R‐TB, R‐Cl−, DT, LHS, WIT, D‐K+, and D‐urea, and these were used to obtain RiskScore. Finally, the two types of predictors were used to construct a nomogram, and the AUC value of this model was recorded to be 0.779, which showed good predictive ability. Importantly, as mentioned previously in the introduction, demographic data has been widely utilized to identify strong risk factors for the occurrence and development of CAP. Therefore, demographic predictors with P < 0.05 were listed independently in the nomogram, and there was no need to enter the LASSO algorithm. In the past, very few studies assessed the impact of clinical data on CAP, resulting in absence of any consensus.
In this study, we included clinical data not previously proven to strongly impact CAP development into a RiskScore using logistic regression and the LASSO algorithm. In a previous study, Mao et al.[19] combined five radioactive risk factors into the 'Radiomics Signature'. It was then incorporated into a nomogram along with other indicators to predict axillary lymph node metastasis in breast cancer. The prediction model was intuitive, concise, and accurate. In addition to this, the sex ratio of donors was found to be extremely unbalanced in the original database included in the present study. This was related to the country's social ideology, family income, and insufficient hospital publicity efforts. Consequently, this imbalance would lead to bias errors in the model and affect the overall model effect. Therefore, to increase the universality of the model, the present study did not incorporate gender factors into the model for consideration.
Our RiskScore contained six easily obtainable pre-surgery blood indicators, including D-urea and R-Cr levels, reflecting the donor's pre-death and recipient's pre-surgery renal function.
Additionally, R‐Cl− and D‐K+ levels were also included, which reflected electrolyte balance in the donor and recipient body environment. Therefore, blood indicators played an active role in the assessment of CAP risk after surgery.
While the cold ischemia time (CIT) is often considered crucial for kidney transplant surgery quality, it was excluded from our model, which contradicts previous studies. This contradicted previous reports[20,21] . With advancements in the field of KT and in‐depth assessment of the mechanism of CIT, it has been observed that the impact of CIT on the prognosis of KT surgery has gradually weakened. In a previous study, Adani L et al.[22] found that the use of low‐temperature mechanical perfusion technology and improvement in the technique used for the preservation of kidney sources, during transportation, significantly reduced the incidence of postoperative infections caused by CIT in DD. The analysis of large‐scale clinical data by Chapal et al.[23] revealed that the use of immunosuppressive agents after KT could ignore the impact of CIT on postoperative CAP, suggesting CIT's declining role in predicting postoperative CAP.
Demographic factors greatly influence the nomogram model. Figure 3 shows that donor and recipient age significantly affect post-KT CAP risk, especially the donor age. Our study had generally older donors and recipients, with ~56.7% donors aged >50 years, whose average creatinine value was 120.9 ± 56.7 µmol/L. About 30.0% of donor deaths were due to cerebrovascular accidents. These data suggest older donors and recipients have increased CAP risk post-KT. Given the aging global population, it's vital to adjust donor risk factor evaluation, recipient complication strategies, and optimize organ allocation and immunosuppression methods[24] .
Obesity in ESRD patients has been seen as a relative contraindication to kidney transplantation (KT) due to increased risks of rejection, kidney loss, or death[25,26] . Our data showed a higher recipient's BMI correlated with an increased post-KT CAP risk.
From clinical statistics, it was observed that the human/kidney survival rate in the CAP group was indeed lower than the non‐CAP group, which was similar to the results obtained for transplantation statistics of other countries[27] . The recent global spread of SARS-COV-2 increased the physical and mental burden on KT patients, the "sensitive population". Elias et al. reported that transplant patients suffering from COVID‐19 exhibited a higher risk of kidney transplant loss and death as compared to the general population[28] . Given the increased life expectancy of transplant patients, it's crucial to focus on individualized treatment and CAP risk factors control, thus reducing post-KT CAP risk. This was our motivation for developing this clinical model.
In our previous research, we successfully explored a predictive model for the occurrence of delayed graft function (DGF) in kidney transplant recipients[29] . As another severe complication following kidney transplantation, early diagnosis and treatment of community-acquired pneumonia (CAP) are also crucial. Therefore, the findings from our study on the CAP predictive model can assist in predicting CAP and help elucidate the unique susceptibility mechanisms associated with it. Looking ahead, integrating microbiological studies to examine the relationship between pulmonary microbiota and infection risk could help explore strategies for reducing the risk of CAP in kidney transplant patients, including those with DGF.
This study has limitations. To improve the model's fit and reduce error regression, more data samples are needed. It's crucial to validate the model with multi-center data. Our database was primarily provincial, so to enhance the model's generalizability and practicality, verification in other provinces or countries is required. Notably, our prediction model only applies to first-time deceased donor kidney transplant recipients.
Conclusions
In summary, the prediction model established using this database integrated two aspects of donors and recipients, screened out 12 risk predictors including demographic and clinical blood indicators, which could effectively predict CAP. The findings of the study would further assist the clinicians in timely diagnosis, and providing timely treatment.
Acknowledgements
Thanks
The authors are grateful for the invaluable support and useful discussions with other members of the urological department.
Author contributions
All authors made substantial contributions to conception and design, acquisition of data, or analysis and interpretation of data; took part in drafting the article or revising it critically for important intellectual content; gave final approval of the version to be published; and agree to be accountable for all aspects of the work.
Ethics approval and consent to participate
This study was conducted with approval from the Ethics Committee of the First Affiliated Hospital of Anhui Medical University (approval number: Quick-PJ 2022-01-33). This study was conducted in accordance with the declaration of Helsinki. Written informed consent was obtained from all participants. Moreover, all kidneys were donated voluntarily with written informed consent, and this was conducted with the Declaration of Istanbul.
Funding information
This research was supported by grants to GY Liao from the National Natural Science Foundation of China (No. 82470783), to J Zhang from the Anhui Hongde-Shanyi Foundation Clinical Research Development Special Fund, and to J Zhang from the National Natural Science Foundation of China (No. 82400890).
Competing Interests
The authors declare that they have no existing or potential commercial or financial relationships that could create a conflict of interest at the time of conducting this study.
Data Availability
All data needed to evaluate the conclusions in the paper are present in the paper or the Supplementary Materials. Additional data related to this paper may be requested from the authors.
References
[1] Wolfe RA, Ashby VB, Milford EL, Ojo AO, Ettenger RE, Agodoa LY, et al. (1999). Comparison of mortality in all patients on dialysis, patients on dialysis awaiting transplantation, and recipients of a first cadaveric transplant. N Engl J Med, 341(23), 1725-1730. https://doi.org/10.1056/nejm199912023412303
[2] Merion RM, Ashby VB, Wolfe RA, Distant DA, Hulbert-Shearon TE, Metzger RA, et al. (2005). Deceased-donor characteristics and the survival benefit of kidney transplantation. Jama, 294(21), 2726-2733. https://doi.org/10.1001/jama.294.21.2726
[3] Hernandez-Fuentes MP, & Lechler RI. (2005). Chronic graft loss. Immunological and non-immunological factors. Contrib Nephrol, 146, 54-64. https://doi.org/10.1159/000082065
[4] Zhang X, Lyu J, Yu X, Wang L, Peng W, Chen J, et al. (2020). Comparison of Graft Outcome Between Donation After Circulatory Death and Living-Donor Kidney Transplantation. Transplant Proc, 52(1), 111-118. https://doi.org/10.1016/j.transproceed.2019.10.001
[5] Kinnunen S, Karhapää P, Juutilainen A, Finne P, & Helanterä I. (2018). Secular Trends in Infection-Related Mortality after Kidney Transplantation. Clin J Am Soc Nephrol, 13(5), 755-762. https://doi.org/10.2215/cjn.11511017
[6] Stratta RJ, Rohr MS, Sundberg AK, Farney AC, Hartmann EL, Moore PS, et al. (2006). Intermediate-term outcomes with expanded criteria deceased donors in kidney transplantation: a spectrum or specter of quality? Ann Surg, 243(5), 594-601; discussion 601-593. https://doi.org/10.1097/01.sla.0000216302.43776.1a
[7] Chen G, Zhang Z, Gu J, Qiu J, Wang C, Kung R, et al. (2010). Incidence and risk factors for pulmonary mycosis in kidney transplantation. Transplant Proc, 42(10), 4094-4098. https://doi.org/10.1016/j.transproceed.2010.10.010
[8] Flabouris K, Chadban S, Ladhani M, Cervelli M, & Clayton P. (2019). Body mass index, weight-adjusted immunosuppression and the risk of acute rejection and infection after kidney transplantation: a cohort study. Nephrol Dial Transplant, 34(12), 2132-2143. https://doi.org/10.1093/ndt/gfz095
[9] Qu JM, & Cao B. (2016). [Guidelines for the diagnosis and treatment of adult community acquired pneumonia in China (2016 Edition)]. Zhonghua Jie He He Hu Xi Za Zhi, 39(4), 241-242. https://doi.org/10.3760/cma.j.issn.1001-0939.2016.04.001
[10] Mandell LA, Wunderink RG, Anzueto A, Bartlett JG, Campbell GD, Dean NC, et al. (2007). Infectious Diseases Society of America/American Thoracic Society consensus guidelines on the management of community-acquired pneumonia in adults. Clin Infect Dis, 44 Suppl 2(Suppl 2), S27-72. https://doi.org/10.1086/511159
[11] Saran R, Robinson B, Abbott KC, Agodoa LY, Albertus P, Ayanian J, et al. (2017). US Renal Data System 2016 Annual Data Report: Epidemiology of Kidney Disease in the United States. Am J Kidney Dis, 69(3 Suppl 1), A7-a8. https://doi.org/10.1053/j.ajkd.2016.12.004
[12] Friedman J, Hastie T, & Tibshirani R. (2010). Regularization Paths for Generalized Linear Models via Coordinate Descent. J Stat Softw, 33(1), 1-22.
[13] Sauerbrei W, Royston P, & Binder H. (2007). Selection of important variables and determination of functional form for continuous predictors in multivariable model building. Stat Med, 26(30), 5512-5528. https://doi.org/10.1002/sim.3148
[14] Kidd AC, McGettrick M, Tsim S, Halligan DL, Bylesjo M, & Blyth KG. (2018). Survival prediction in mesothelioma using a scalable Lasso regression model: instructions for use and initial performance using clinical predictors. BMJ Open Respir Res, 5(1), e000240. https://doi.org/10.1136/bmjresp-2017-000240
[15] Kramer AA, & Zimmerman JE. (2007). Assessing the calibration of mortality benchmarks in critical care: The Hosmer-Lemeshow test revisited. Crit Care Med, 35(9), 2052-2056. https://doi.org/10.1097/01.Ccm.0000275267.64078.B0
[16] Vickers AJ, Cronin AM, Elkin EB, & Gonen M. (2008). Extensions to decision curve analysis, a novel method for evaluating diagnostic tests, prediction models and molecular markers. BMC Med Inform Decis Mak, 8, 53. https://doi.org/10.1186/1472-6947-8-53
[17] Purnell TS, Auguste P, Crews DC, Lamprea-Montealegre J, Olufade T, Greer R, et al. (2013). Comparison of life participation activities among adults treated by hemodialysis, peritoneal dialysis, and kidney transplantation: a systematic review. Am J Kidney Dis, 62(5), 953-973. https://doi.org/10.1053/j.ajkd.2013.03.022
[18] Silva SB, Caulliraux HM, Araújo CA, & Rocha E. (2016). Cost comparison of kidney transplant versus dialysis in Brazil. Cad Saude Publica, 32(6). https://doi.org/10.1590/0102-311x00013515
[19] Mao N, Yin P, Li Q, Wang Q, Liu M, Ma H, et al. (2020). Radiomics nomogram of contrast-enhanced spectral mammography for prediction of axillary lymph node metastasis in breast cancer: a multicenter study. Eur Radiol, 30(12), 6732-6739. https://doi.org/10.1007/s00330-020-07016-z
[20] Schlott F, Steubl D, Hoffmann D, Matevossian E, Lutz J, Heemann U, et al. (2017). Primary Cytomegalovirus Infection in Seronegative Kidney Transplant Patients Is Associated with Protracted Cold Ischemic Time of Seropositive Donor Organs. PLoS One, 12(1), e0171035. https://doi.org/10.1371/journal.pone.0171035
[21] Sucher R, Wagner T, Köhler H, Sucher E, Quice H, Recknagel S, et al. (2022). Hyperspectral Imaging (HSI) of Human Kidney Allografts. Ann Surg, 276(1), e48-e55. https://doi.org/10.1097/sla.0000000000004429
[22] Adani GL, Pravisani R, Tulissi P, Isola M, Calini G, Terrosu G, et al. (2021). Hypothermic machine perfusion can safely prolong cold ischemia time in deceased donor kidney transplantation. A retrospective analysis on postoperative morbidity and graft function. Artif Organs, 45(5), 516-523. https://doi.org/10.1111/aor.13858
[23] Chapal M, Le Borgne F, Legendre C, Kreis H, Mourad G, Garrigue V, et al. (2014). A useful scoring system for the prediction and management of delayed graft function following kidney transplantation from cadaveric donors. Kidney Int, 86(6), 1130-1139. https://doi.org/10.1038/ki.2014.188
[24] Sutherland AI, JN IJ, Forsythe JL, & Dor FJ. (2016). Kidney and liver transplantation in the elderly. Br J Surg, 103(2), e62-72. https://doi.org/10.1002/bjs.10064
[25] Meier-Kriesche HU, Arndorfer JA, & Kaplan B. (2002). The impact of body mass index on renal transplant outcomes: a significant independent risk factor for graft failure and patient death. Transplantation, 73(1), 70-74. https://doi.org/10.1097/00007890-200201150-00013
[26] Ladhani M, Lade S, Alexander SI, Baur LA, Clayton PA, McDonald S, et al. (2017). Obesity in pediatric kidney transplant recipients and the risks of acute rejection, graft loss and death. Pediatr Nephrol, 32(8), 1443-1450. https://doi.org/10.1007/s00467-017-3636-1
[27] Sarnak MJ, & Jaber BL. (2001). Pulmonary infectious mortality among patients with end-stage renal disease. Chest, 120(6), 1883-1887. https://doi.org/10.1378/chest.120.6.1883
[28] Elias M, Pievani D, Randoux C, Louis K, Denis B, Delion A, et al. (2020). COVID-19 Infection in Kidney Transplant Recipients: Disease Incidence and Clinical Outcomes. J Am Soc Nephrol, 31(10), 2413-2423. https://doi.org/10.1681/asn.2020050639
[29] Pan J, & Liao G. (2021). Development and Validation of Nomogram for Predicting Delayed Graft Function After Kidney Transplantation of Deceased Donor. Int J Gen Med, 14, 9103-9115. https://doi.org/10.2147/ijgm.S331854
 Figures
 References
 Peer
Peer Information
Figure 1. Flow chart of the prediction model of community-acquired pneumonia after KT from the deceased donors.
Figure 2. Feature selection of the clinical indicators using the LASSO binary regression model. (A) In the LASSO model, the best lambda parameter was selected using 5-fold cross-validation and minimal criteria. The curve of the partial likelihood deviance (binomial deviance) was plotted versus the logarithm of the lambda parameter. Dotted vertical lines were drawn at the optimal values using the minimum criteria and the I SE of the minimum criteria (I-SE criteria). (B) For 8 characteristics, the LASSO coefficient profiles were created. Each coefficient profile was displayed against the lambda parameter's logarithm. The vertical line was generated using 5-fold cross-validation at the selected value, where the best lambda value was generated in 8 features with nonzero coefficients. Abbreviation: SE: Standard Error. (C) The nomogram for predicting the occurrence of community-acquired pneumonia after KT from the deceased donors. The nomogram of community-acquired pneumonia after KT developed by cohort included Riskcore, D-age, R-age, D-BMI, and R-BMI. The RiskScore includes 8 clinical predictors of R-Cr, R-TB, R-Cl-, DT, LHS, WIT, D-K+, and D-urea.
Figure 3. Effectiveness evaluation of the nomogram model. (A) The receiver operating characteristic (ROC) curve of the nomogram of the risk prediction after transplantation. The X-axis and Y-axis reflect the false positive rate and true positive rate of post-transplant morbidity prediction. The AUC value was 0.779. (B) The calibration curve of the CAP-risk prediction nomogram after transplantation. After transplantation, the CAP prediction is represented on the X-axis, while the actual CAP is represented on the Y-axis. The perfect prediction result of the ideal model matches the diagonal dashed line. The nomogram performance is represented by a solid line, and a match closer to the diagonal dashed line indicates a better prediction. (C) For CAP after transplantation, decision curve analysis (DCA) was performed. The Y-axis represents the net income. The CAP risk nomogram after transplantation is indicated by a red line. The thin solid line represents the hypothesis that all recipients could survive after transplantation, while the thick solid line represents the hypothesis that all kidney recipients will suffer CAP after transplantation. The decision curve indicates that the threshold probabilities for patients and doctors are >0.13 and <0.61, respectively. The current study results indicate that the morbidity risk nomogram could be used for post-KT morbidity risk prediction as it is more helpful than intervention-for-all-recipients or no-intervention schemes.
Figure 4. (A) The K-M curve of recipient survival after kidney transplantation. (B) The K-M curve of transplanted kidney functions after kidney transplantation. ***P < 0.001
[1] Wolfe RA, Ashby VB, Milford EL, Ojo AO, Ettenger RE, Agodoa LY, et al. (1999). Comparison of mortality in all patients on dialysis, patients on dialysis awaiting transplantation, and recipients of a first cadaveric transplant. N Engl J Med, 341(23), 1725-1730. https://doi.org/10.1056/nejm199912023412303
[2] Merion RM, Ashby VB, Wolfe RA, Distant DA, Hulbert-Shearon TE, Metzger RA, et al. (2005). Deceased-donor characteristics and the survival benefit of kidney transplantation. Jama, 294(21), 2726-2733. https://doi.org/10.1001/jama.294.21.2726
[3] Hernandez-Fuentes MP, & Lechler RI. (2005). Chronic graft loss. Immunological and non-immunological factors. Contrib Nephrol, 146, 54-64. https://doi.org/10.1159/000082065
[4] Zhang X, Lyu J, Yu X, Wang L, Peng W, Chen J, et al. (2020). Comparison of Graft Outcome Between Donation After Circulatory Death and Living-Donor Kidney Transplantation. Transplant Proc, 52(1), 111-118. https://doi.org/10.1016/j.transproceed.2019.10.001
[5] Kinnunen S, Karhapää P, Juutilainen A, Finne P, & Helanterä I. (2018). Secular Trends in Infection-Related Mortality after Kidney Transplantation. Clin J Am Soc Nephrol, 13(5), 755-762. https://doi.org/10.2215/cjn.11511017
[6] Stratta RJ, Rohr MS, Sundberg AK, Farney AC, Hartmann EL, Moore PS, et al. (2006). Intermediate-term outcomes with expanded criteria deceased donors in kidney transplantation: a spectrum or specter of quality? Ann Surg, 243(5), 594-601; discussion 601-593. https://doi.org/10.1097/01.sla.0000216302.43776.1a
[7] Chen G, Zhang Z, Gu J, Qiu J, Wang C, Kung R, et al. (2010). Incidence and risk factors for pulmonary mycosis in kidney transplantation. Transplant Proc, 42(10), 4094-4098. https://doi.org/10.1016/j.transproceed.2010.10.010
[8] Flabouris K, Chadban S, Ladhani M, Cervelli M, & Clayton P. (2019). Body mass index, weight-adjusted immunosuppression and the risk of acute rejection and infection after kidney transplantation: a cohort study. Nephrol Dial Transplant, 34(12), 2132-2143. https://doi.org/10.1093/ndt/gfz095
[9] Qu JM, & Cao B. (2016). [Guidelines for the diagnosis and treatment of adult community acquired pneumonia in China (2016 Edition)]. Zhonghua Jie He He Hu Xi Za Zhi, 39(4), 241-242. https://doi.org/10.3760/cma.j.issn.1001-0939.2016.04.001
[10] Mandell LA, Wunderink RG, Anzueto A, Bartlett JG, Campbell GD, Dean NC, et al. (2007). Infectious Diseases Society of America/American Thoracic Society consensus guidelines on the management of community-acquired pneumonia in adults. Clin Infect Dis, 44 Suppl 2(Suppl 2), S27-72. https://doi.org/10.1086/511159
[11] Saran R, Robinson B, Abbott KC, Agodoa LY, Albertus P, Ayanian J, et al. (2017). US Renal Data System 2016 Annual Data Report: Epidemiology of Kidney Disease in the United States. Am J Kidney Dis, 69(3 Suppl 1), A7-a8. https://doi.org/10.1053/j.ajkd.2016.12.004
[12] Friedman J, Hastie T, & Tibshirani R. (2010). Regularization Paths for Generalized Linear Models via Coordinate Descent. J Stat Softw, 33(1), 1-22.
[13] Sauerbrei W, Royston P, & Binder H. (2007). Selection of important variables and determination of functional form for continuous predictors in multivariable model building. Stat Med, 26(30), 5512-5528. https://doi.org/10.1002/sim.3148
[14] Kidd AC, McGettrick M, Tsim S, Halligan DL, Bylesjo M, & Blyth KG. (2018). Survival prediction in mesothelioma using a scalable Lasso regression model: instructions for use and initial performance using clinical predictors. BMJ Open Respir Res, 5(1), e000240. https://doi.org/10.1136/bmjresp-2017-000240
[15] Kramer AA, & Zimmerman JE. (2007). Assessing the calibration of mortality benchmarks in critical care: The Hosmer-Lemeshow test revisited. Crit Care Med, 35(9), 2052-2056. https://doi.org/10.1097/01.Ccm.0000275267.64078.B0
[16] Vickers AJ, Cronin AM, Elkin EB, & Gonen M. (2008). Extensions to decision curve analysis, a novel method for evaluating diagnostic tests, prediction models and molecular markers. BMC Med Inform Decis Mak, 8, 53. https://doi.org/10.1186/1472-6947-8-53
[17] Purnell TS, Auguste P, Crews DC, Lamprea-Montealegre J, Olufade T, Greer R, et al. (2013). Comparison of life participation activities among adults treated by hemodialysis, peritoneal dialysis, and kidney transplantation: a systematic review. Am J Kidney Dis, 62(5), 953-973. https://doi.org/10.1053/j.ajkd.2013.03.022
[18] Silva SB, Caulliraux HM, Araújo CA, & Rocha E. (2016). Cost comparison of kidney transplant versus dialysis in Brazil. Cad Saude Publica, 32(6). https://doi.org/10.1590/0102-311x00013515
[19] Mao N, Yin P, Li Q, Wang Q, Liu M, Ma H, et al. (2020). Radiomics nomogram of contrast-enhanced spectral mammography for prediction of axillary lymph node metastasis in breast cancer: a multicenter study. Eur Radiol, 30(12), 6732-6739. https://doi.org/10.1007/s00330-020-07016-z
[20] Schlott F, Steubl D, Hoffmann D, Matevossian E, Lutz J, Heemann U, et al. (2017). Primary Cytomegalovirus Infection in Seronegative Kidney Transplant Patients Is Associated with Protracted Cold Ischemic Time of Seropositive Donor Organs. PLoS One, 12(1), e0171035. https://doi.org/10.1371/journal.pone.0171035
[21] Sucher R, Wagner T, Köhler H, Sucher E, Quice H, Recknagel S, et al. (2022). Hyperspectral Imaging (HSI) of Human Kidney Allografts. Ann Surg, 276(1), e48-e55. https://doi.org/10.1097/sla.0000000000004429
[22] Adani GL, Pravisani R, Tulissi P, Isola M, Calini G, Terrosu G, et al. (2021). Hypothermic machine perfusion can safely prolong cold ischemia time in deceased donor kidney transplantation. A retrospective analysis on postoperative morbidity and graft function. Artif Organs, 45(5), 516-523. https://doi.org/10.1111/aor.13858
[23] Chapal M, Le Borgne F, Legendre C, Kreis H, Mourad G, Garrigue V, et al. (2014). A useful scoring system for the prediction and management of delayed graft function following kidney transplantation from cadaveric donors. Kidney Int, 86(6), 1130-1139. https://doi.org/10.1038/ki.2014.188
[24] Sutherland AI, JN IJ, Forsythe JL, & Dor FJ. (2016). Kidney and liver transplantation in the elderly. Br J Surg, 103(2), e62-72. https://doi.org/10.1002/bjs.10064
[25] Meier-Kriesche HU, Arndorfer JA, & Kaplan B. (2002). The impact of body mass index on renal transplant outcomes: a significant independent risk factor for graft failure and patient death. Transplantation, 73(1), 70-74. https://doi.org/10.1097/00007890-200201150-00013
[26] Ladhani M, Lade S, Alexander SI, Baur LA, Clayton PA, McDonald S, et al. (2017). Obesity in pediatric kidney transplant recipients and the risks of acute rejection, graft loss and death. Pediatr Nephrol, 32(8), 1443-1450. https://doi.org/10.1007/s00467-017-3636-1
[27] Sarnak MJ, & Jaber BL. (2001). Pulmonary infectious mortality among patients with end-stage renal disease. Chest, 120(6), 1883-1887. https://doi.org/10.1378/chest.120.6.1883
[28] Elias M, Pievani D, Randoux C, Louis K, Denis B, Delion A, et al. (2020). COVID-19 Infection in Kidney Transplant Recipients: Disease Incidence and Clinical Outcomes. J Am Soc Nephrol, 31(10), 2413-2423. https://doi.org/10.1681/asn.2020050639
[29] Pan J, & Liao G. (2021). Development and Validation of Nomogram for Predicting Delayed Graft Function After Kidney Transplantation of Deceased Donor. Int J Gen Med, 14, 9103-9115. https://doi.org/10.2147/ijgm.S331854
Peer-review Terminology
Identity transparency: Single anonymized
Reviewer interacts with: Editor
Details
This is an open access article under the terms of the Creative Commons Attribution License(http://creativecommons.org/licenses/by/4.0/), which permits use, distribution and reproduction in any medium, provided the original work is properly cited.
Publication History
Received 2025-01-05
Accepted 2025-03-15
Published 2025-03-30