


Abstract
Background: Testicular cancer (TC) is the most common solid malignancy in young men, and the causal relationship between height and TC remains controversial to date.
Methods: We applied a two-sample Mendelian randomization (MR) framework using large-scale genome-wide association study summary statistics to estimate the causal effect of adult height on TC risk. This was supported by LD Score regression, stringent instrument selection, and an extensive sensitivity portfolio. Cohort-specific estimates were pooled via random-effects meta-analysis. Mechanistic inference included gene-set enrichment and an integrated Summary-data-based Mendelian Randomization (SMR)-colocalization pipeline to prioritize susceptibility genes.
Results: Height was causally associated with higher TC risk in two independent cohorts (OR 1.384, 95% CI 1.029-1.861; P<0.05) and in meta-analysis (pooled OR 1.354, 95% CI 1.112-1.644), with concordant directions across robustness estimators, no evidence of directional pleiotropy, and minimal heterogeneity. Bidirectional MR found no reverse effect of TC liability on height (P>0.05), and regional colocalization did not support shared causal variants between height and TC signals (PP.H4<0.50). Enrichment implicated a height-chondrogenesis-extracellular matrix-TGF-β/SMAD-endocrine axis. SMR and colocalization convergently nominated PMF1 (PP.H4=0.80) and SLC9B2 (PP.H4=0.95) as susceptibility genes with high posterior support across cohorts.
Conclusion: Genetically proxied height confers a modest but robust increase in TC risk, and PMF1 and SLC9B2 emerge as plausible mediators at colocalized regulatory loci.
Keywords: Height; Testicular cancer; Mendelian randomization; Bayesian colocalization; Susceptibility gene.
Introduction
Testicular cancer (TC) ranks as the most common solid tumor among males aged 15-44 years, comprising approximately 1-2% of all male malignancies worldwide[1]. In 2025, the United States is expected to report nearly 9,720 new cases and about 600 deaths, with a median age at diagnosis of 33 years. Incidence has risen steadily over recent decades, particularly in high-income regions: Western and Northern Europe exhibit the highest age-standardized incidence rates-8.7 and 7.2 per 100,000 men, respectively-while projections suggest a 24% increase in Europe by 2025 compared to 2005 levels[2, 3]. Established risk factors encompass cryptorchidism, a positive family history, prior testicular pathology, and hormonal imbalances[4]. Epidemiological analyses indicate that each 5 cm increment in adult height correlates with a roughly 13% elevation in TC risk. Environmental and lifestyle exposures-such as cannabis use, agricultural chemicals, and occupational hazards-have also been implicated, though findings remain inconsistent[5, 6].
Conventional observational studies, while foundational, often struggle with residual confounding, measurement error, and reverse causation. For example, analyses based on SEER registry data cannot disentangle whether height causally influences tumorigenesis or merely reflects early life nutritional and socioeconomic conditions. Consequently, the causal link between stature and TC remains unresolved[6].
Mendelian randomization (MR) offers a powerful alternative by employing germline variants associated with height as instrumental variables. This approach leverages the random assortment of alleles at conception to mitigate confounding and reverse causation, paralleling randomization in controlled trials, thus strengthening causal inference[7-9]. Moreover, summary-data-based MR (SMR) integrates genome-wide association study (GWAS) and expression quantitative trait loci (eQTL) data to colocalize genetic signals, pinpoint susceptibility genes, and nominate therapeutic targets[10-12].
Here, we apply state-of-the-art two-sample MR using extensive GWAS meta-analyses of adult height and TC, aiming to resolve the causal role of height in tumor risk. Concurrently, SMR analysis interrogates GWAS and eQTL summary statistics to identify and prioritize genes whose expression mediates testicular carcinogenesis.
Methods and Materials
Study Design
Genome-wide linkage disequilibrium (LD) score regression was used to characterize
polygenicity and residual confounding and to estimate the genetic correlation between adult height and TC across
cohorts. A two-sample MR framework based on GWAS summary statistics then quantified the causal effect of height on
testicular cancer risk. The study adhered to STROBE-MR reporting standards and aligned with the three core
instrumental-variable assumptions: (i) genetic instruments exhibit strong and robust associations with the exposure,
(ii) instruments are independent of measured and unmeasured confounders, and (iii) instruments influence the outcome
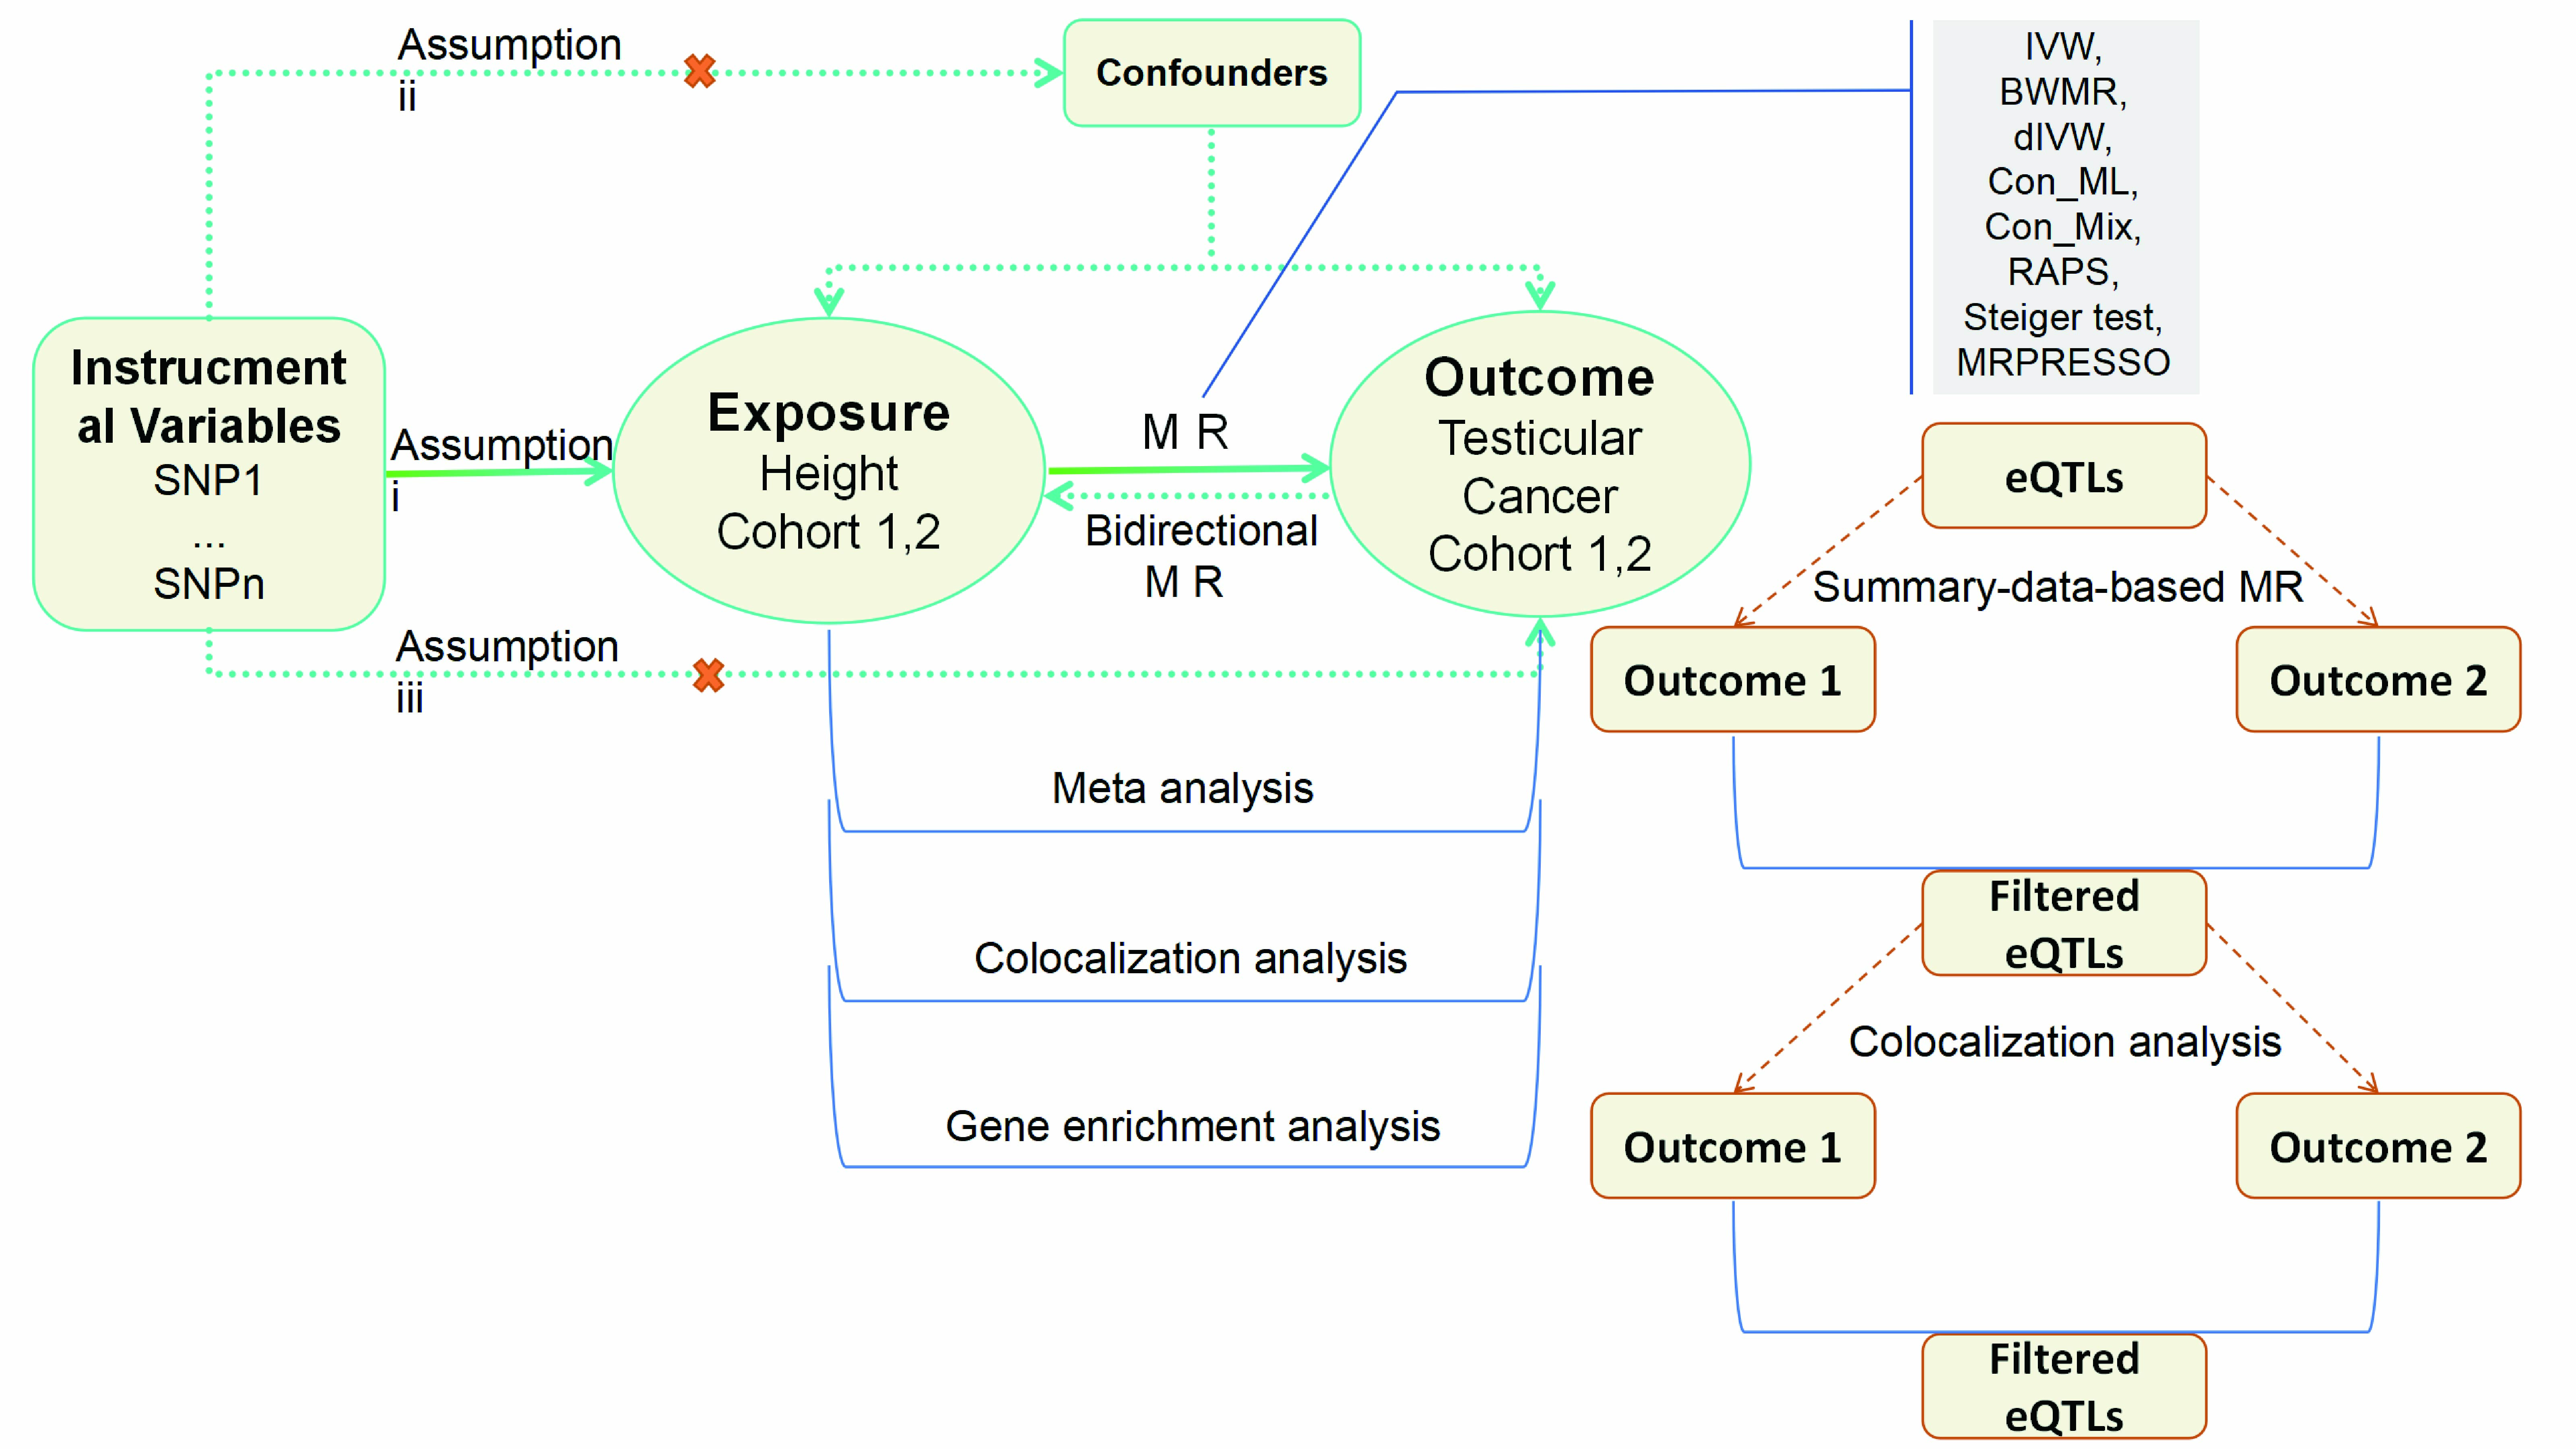
solely through the exposure (Figure 1)[13].
The analytical workflow comprised cohort-specific MR estimation, random-effects meta-analysis to pool causal effects across cohorts, and colocalization analyses to assess whether exposure and outcome signals share causal variants at implicated loci. Biological interpretation included gene-set and pathway enrichment analyses of mapped genes from associated variants. Target nomination leveraged SMR integrated with colocalization to prioritize putative therapeutic genes with convergent GWAS and eQTL evidence.
Figure 1. An outline of the study's approach. Utilizing a bidirectional Mendelian randomization framework. SNP: single nucleotide polymorphism, IVW: Inverse-variance weighted method, dIVW: debiased inverse-variance weighted method, RAPS: Robust adjusted profile score, Con_ML: constrained maximum likelihood and model averaging, Con_Mix: contamination mixture, BWMR: Bayesian weighted Mendelian randomization, MRPRESSO: Mendelian Randomization Pleiotropy RESidual Sum and Outlier.
Data Sources
We leveraged data from two cohorts to ensure a broad and diverse genetic representation for
our MR analysis. In Cohort 1, Height: Measurements were obtained from the UK Biobank (n = 336,474). TC: Diagnoses were
derived from the latest FinnGen biobank release, specifically from the cancer registry using ICD-O-3 codes for
neoplasms (total n = 144,160; cases = 536, controls = 143,624). In Cohort 2, Height: Measurements were obtained from
the IEU GWAS database (n = 360,388). TC: Diagnoses were extracted from the UK Biobank, defined using PheCode 187.2 for
malignant neoplasm of the testis (total n = 208,768; cases = 797, controls = 207,971). eQTLs data were sourced from
the eQTLGen Consortium[14]. Table S1 provides a comprehensive overview
of the datasets employed.
LD score regression
LD Score regression leverages GWAS summary statistics to estimate SNP-based
heritability, partition that heritability across overlapping functional annotations, and quantify genetic correlations
between phenotypes. For each variant, the LD score quantifies the extent of LD it captures and is defined as the sum
of squared correlations with neighboring SNPs within a specified window. This study computed LD scores using the
European-ancestry reference panel from the 1000 Genomes Project[15]. Univariate and cross-trait LD
Score regression yielded intercepts indexing residual confounding, SNP-heritability estimates, genetic correlations,
and related parameters used to assess the genetic contributions to the complex diseases and traits analyzed[16, 17].
Selection of genetic instruments
Genetic instruments were restricted to variants reaching genome‑wide
significance (p < 5.0×10⁻⁸). Independence among instruments was enforced by LD clumping using r² < 0.001 within a 10
Mb window to minimize correlation among selected SNPs[18]. Instrument strength was quantified with
the F-statistic, and only variants with F > 10 were retained to limit weak‑instrument bias; during screening, the
F-statistic was approximated as F = (β/se)²[19, 20]. Directionality was
evaluated with the Steiger test to remove variants that explained more variance in the outcome than in the exposure[21]. Harmonization procedures excluded palindromic SNPs with intermediate allele frequencies to avoid strand ambiguity
and preserved alignment of effect alleles across datasets.
For SMR analyses, instruments were limited to cis-eQTLs located within ±1 Mb of the gene region. Eligible eQTLs showed GWAS with gene expression measured in whole blood (p < 5.0×10⁻⁸) and had a minor allele frequency greater than 1%. This selection ensured biologically proximate regulatory instruments with adequate statistical strength for downstream inference[22].
MR analysis and sensitivity analyses
The primary causal estimator was the IVW method[23], selected for its efficiency and conservative behavior under heterogeneity and implemented under a multiplicative
random-effects framework where appropriate. Outlier detection and correction were performed with MR PRESSO, including
the global test and outlier removal[24].
Sensitivity analyses included complementary robustness estimators: BWMR to downweight pleiotropic instruments[25]; the Con_Mix model to accommodate mixtures of valid and invalid instruments[26]; MR RAPS for robustness under weak instruments and idiosyncratic pleiotropy[27]; Con_ML to address correlated and uncorrelated pleiotropy[28]; and the dIVW estimator to reduce weak-instrument bias[29]. Single-variant effects were summarized with the Wald ratio. Additional procedures comprised leave-one-out analyses to assess leverage by individual instruments and repeated MR PRESSO outlier checks after instrument refinement. Sample overlap was assessed with MRlap[30]; when p_difference > 0.05, any overlap is unlikely to materially affect statistical power. Heterogeneity was quantified using Cochran’s Q[31]; a non-significant p-value (>0.05) indicated no substantial between-instrument heterogeneity, whereas a significant result prompted use of the IVW multiplicative random-effects specification. Horizontal pleiotropy was evaluated with the MR-Egger intercept[32]; a non-significant p-value (>0.05) was taken as no evidence for directional pleiotropy.
For SMR, instrument validity was assessed with the HEIDI test, with p > 0.05 indicating no significant heterogeneity in variant effects on the gene-trait relationship. The parameter heidi-mtd governed implementation (0 for the original algorithm; 1 as the default improved procedure using up to 20 SNPs for enhanced performance)[22, 33]. Potential confounding was examined by querying external variant–phenotype resources to identify links between candidate instruments and established TC factors (HIV infection, family history, age, or cryptorchidism[4, 5, 34]). Variants flagged as associated with confounders were removed, and causal estimates were re-derived to confirm the stability of inference.
Colocalization analysis
The Bayesian colocalization framework quantified whether the same causal variant
drives two association signals by calculating approximate Bayes factors and transforming them into posterior
probabilities for five mutually exclusive hypotheses. The hypotheses comprised: H0, neither the exposure signal nor
the GWAS trait harbors a causal variant within the locus; H1/H2, only the exposure or only the GWAS trait contains a
causal variant; H3, both traits contain distinct causal variants; and H4, both traits share a single causal variant.
Genomic windows were defined as ±50 kb around index variants for GWAS-GWAS comparisons and ±1 Mb around the gene for
eQTL-GWAS analyses[35, 36]. Evidence for colocalization was classified as
suggestive at Posterior probabilities for hypothesis H4 (PP.H4) ≥ 0.50 and strong at PP.H4 ≥ 0.75[37, 38].
Statistics
Analyses were conducted in R (version 4.4.3) using the following packages: TwoSampleMR
(v0.5.10), MendelianRandomization (v0.8.0), coloc (v5.1.1), meta (v6.2-1), SMR (v1.03), MRPRESSO (v1.0), MRlapPro
(v0.0.3)[30], Bioconductor (v3.21), clusterProfiler (v4.16.0)[39], and
gprofiler2 (v0.2.3)[40]. Statistical power was evaluated with an online calculator[41]. SNP-gene set enrichment was performed with g: Profiler[40]. Statistical significance was
defined as a two-sided p-value < 0.05 unless otherwise specified.
Results
LD Score regression and Gene Set Enrichment Analysis Reveal Genetic Correlation for Height and TC
LD Score
regression, which distinguishes polygenicity from confounding in GWAS, was applied to assess genetic overlap between
adult height and TC. In cohort 1, the height phenotype yielded a Z-score of 18.75 (p=1.62×10⁻⁷⁸), whereas TC produced
a Z-score of 1.46 (p=0.146). Cohort 2 showed analogous findings, with Z-scores of 20.42 (p=1.16×10⁻⁹²) for height and
3.44 (p=5.87×10⁻⁴) for TC (Figure S1A). Lambda GC values for the TC phenotype remained
below 1.05, indicating minimal population stratification or systematic bias in both datasets[42].
A genome-wide significance threshold (p<5×10⁻⁸) in cohort 1 identified 607 independent height-associated SNPs. Annotation of these variants mapped to 393 genes, which were most strongly enriched for the “Body height” term in DisGeNET (adjusted p=1.88×10⁻⁸) (Figure S1B; Table S2). Similarly, 81 TC-associated SNPs corresponded to genes enriched in the “TC” category of the Jensen_DISEASES database (adjusted p=4.89×10⁻⁵) (Figure S1C; Table S2). These enrichment results corroborate that the selected SNPs capture phenotype-specific genetic signals.
Association of Genetically Predicted Height with TC Risk
Cohort 1 supported a causal association between
height and TC. After LD pruning, minor allele frequency filtering, and harmonization, 578 height-associated variants
were identified; eight variants linked to potential confounders were removed, leaving 570 instruments for analysis.
The IVW estimator indicated higher TC risk with greater genetically predicted height (Odds ratio (OR) 1.384; 95%
Confidence Interval (CI) 1.029-1.861; p = 0.031; Figure 2A).
Robustness assessments were consistent with the primary finding. MRPRESSO returned a significant result (p = 0.032), and concordant estimates arose from Con_Mix, RAPS, dIVW, Con_ML, and BWMR methods (Figure 2A). Power to detect the observed effect was 0.618. Leave-one-out analyses showed no variant materially altered the association (Table S3). The MR-Egger intercept provided no evidence of directional pleiotropy (p = 0.535), and Cochran’s Q suggested no substantial heterogeneity across instruments (p = 0.070) (Table S4). Cohort 2 provided independent validation. After excluding six pleiotropic variants, the IVW estimate remained significant (OR 1.328; 95% CI 1.024-1.723; p = 0.032), with supporting results across sensitivity analyses (Figure 2A; Table S4).
A random-effects meta-analysis pooled cohort-specific estimates. The combined effect size demonstrated a robust association between genetically predicted height and TC risk (pooled OR 1.35; 95% CI 1.12-1.64; p = 0.002; Figure 2B). A non-significant heterogeneity test (p = 0.84) indicated minimal between-cohort variability, reinforcing the consistency and reliability of the causal estimate.
Figure 2. Causal effect of genetically proxied height on TC risk. (A) Forest plots of two-sample MR estimates from two independent cohorts. IVW and MR-PRESSO are prespecified primary estimators; RAPS, dIVW, Con_ML, ConMix, and BWMR serve as sensitivity analyses. Effect sizes are OR for TC per 1 SD increase in genetically predicted height with 95% CI; OR > 1 indicates higher risk. (B) Random-effects meta-analysis pooling cohort-specific IVW estimates. The pooled effect is reported as OR with 95% CI and two-sided P value. Between-cohort heterogeneity was evaluated using Cochran’s Q; P_heterogeneity > 0.05 indicates no material heterogeneity.

Absence of reverse causality between height and TC based on bidirectional MR and colocalization analyses
Bidirectional MR assessed whether genetic liability to TC influences adult height under the same instrument
selection criteria used for the forward direction. Reverse-direction instruments comprised two SNPs in Cohort 1 and
six SNPs in Cohort 2, and IVW estimates were null (p = 0.759 and p = 0.834, respectively;
Table S5), indicating no evidence that TC genetic predisposition causally affects height.
Colocalization analysis evaluated whether height and TC association signals share a causal variant within ±50 kb
windows around index loci[35]. PP.H4 were 0.04 in Cohort 1 and 0.02 in Cohort 2, values that do not
support colocalization of the two phenotypes in the queried regions. Concordant null results from reverse-direction MR
and low colocalization probabilities indicate a primarily unidirectional relationship, whereby genetic determinants of
adult height modulate TC risk rather than the converse.
SNP-gene Enrichment Reveals Potential Mechanisms Linking Height to TC Risk
To delineate putative
mechanistic links between the height phenotype and TC, the analysis compiled 1,232 SNPs from both cohorts. It removed
111 duplicates, followed by functional annotation with g: Profiler[40], which mapped 506 unique
genes. Gene Ontology (GO) enrichment indicated predominant biological process terms including connective tissue
development, cartilage development, chondrocyte differentiation, skeletal system morphogenesis, and cellular response
to transforming growth factor beta stimulus (Figure 3A). Cellular component terms were enriched for
collagen-containing extracellular matrix (ECM), microfibril, SMAD protein complex, sex chromosome, and transcription
regulator complex (Figure 3B). Molecular function terms were enriched for extracellular matrix
structural constituent, I-SMAD binding, RNA polymerase II-specific DNA-binding transcription activator activity, and
SMAD binding (Figure 3C). Kyoto Encyclopedia of Genes and Genomes (KEGG) pathway analysis
highlighted Human T-cell leukemia virus 1 infection, Growth hormone synthesis, secretion and action, Insulin
resistance, Relaxin signaling pathway, and Endocrine resistance (Figure 3D,
Table S6). These enrichment profiles cohere with a height-chondrogenesis-extracellular
matrix-endocrine axis and provide biologically plausible support for the inferred causal relationship between height
and TC.
Figure 3. Functional enrichment of height-TC-associated genes. The enrichment analysis using clusterProfiler identified significant terms in (A) GO Biological Process, (B) GO Cellular Component, (C) GO Molecular Function, and (D) KEGG pathways. Dots encode term size (Count) and adjusted significance, x-axis shows EnrichmentScore=−log10(p). Terms shown are the top 10 per panel after filtering at p.adjust<0.05 and, where applicable, semantic similarity trimming.

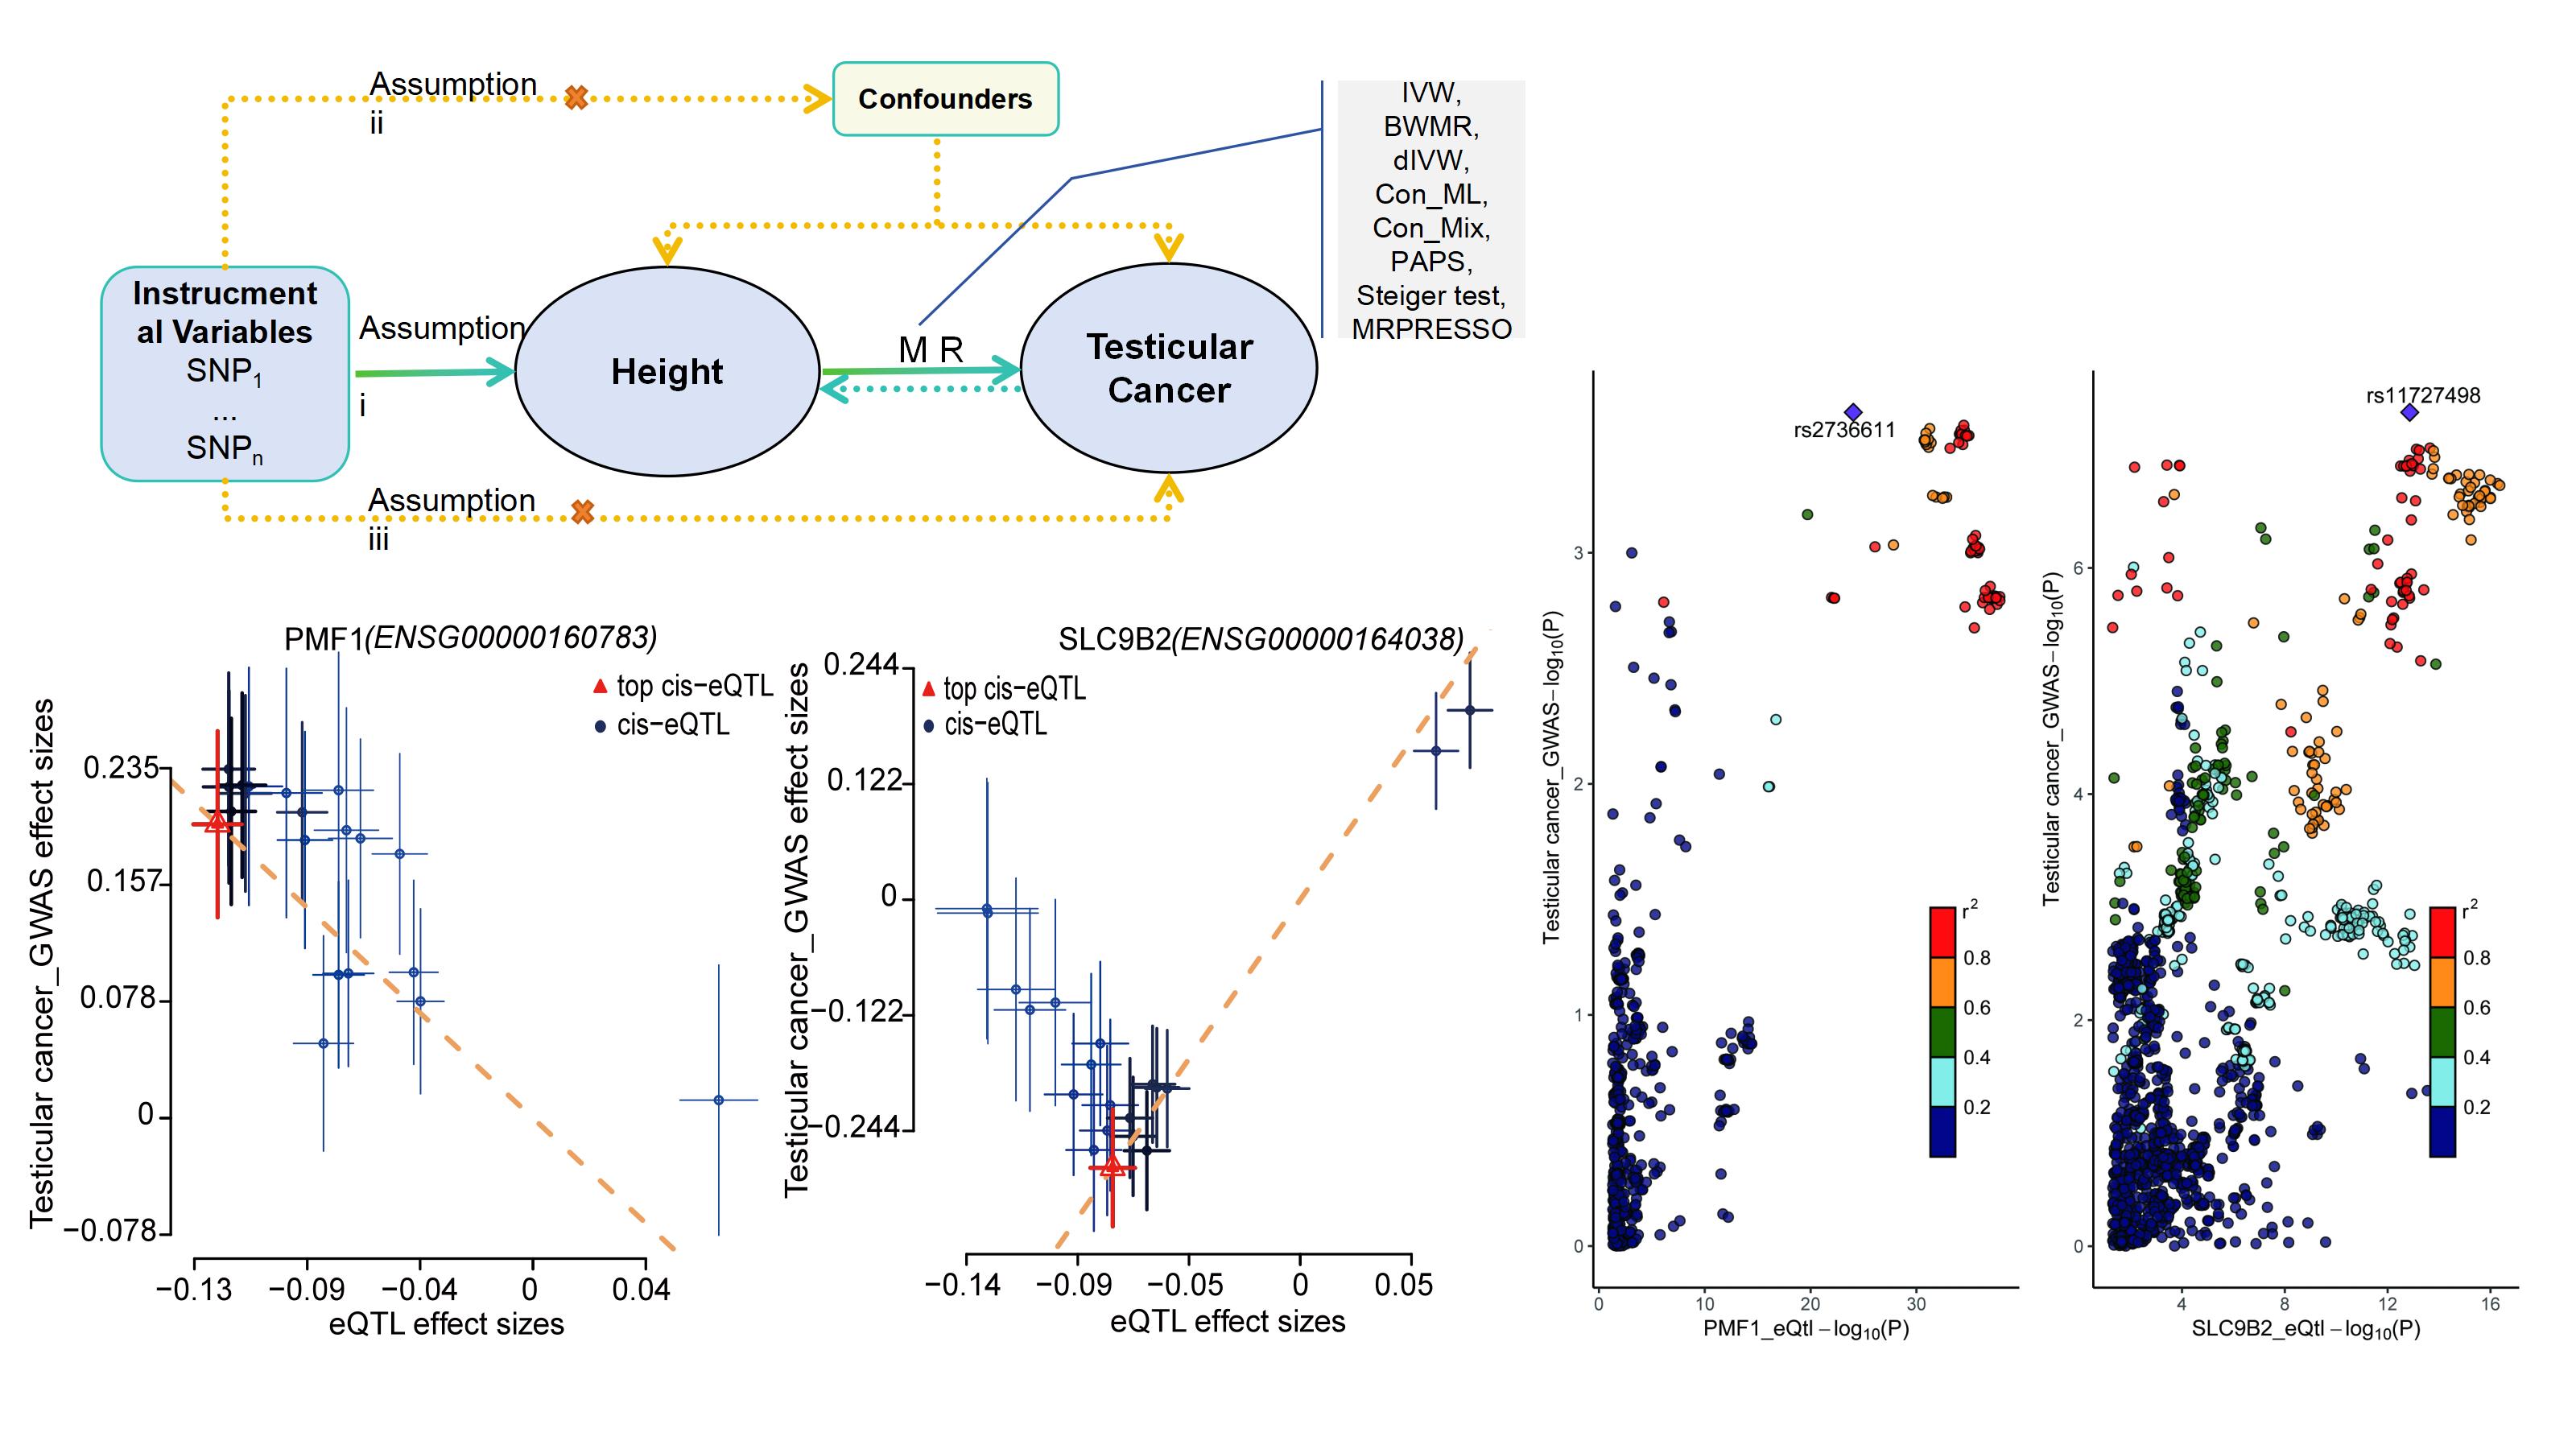
PMF1 and SLC9B2 as potential susceptibility genes in TC from SMR and colocalization analysis
SMR analysis
prioritized TC-associated genes using eQTL instruments. In Cohort 1, application of p_SMR < 0.05 and p_HEIDI > 0.05
identified 721 genes (Figure 4A). In Cohort 2, the same criteria yielded 711 genes (Figure 4B). The intersection of the two gene sets resulted in 44 candidates (Table S7, S8).
Colocalization analysis was then performed for these 44 genes in both cohorts. Five genes in Cohort 1 (CES4A, PMF1,
LRRC37A15P, MAP2K1, and SLC9B2) and six genes in Cohort 2 (PRR13, PMF1, CLPTM1L, RP11-10L12.2, BDH2, and SLC9B2)
showed PP.H4 values above the suggestive threshold of 0.5 (Figure 4C). Only PMF1 and SLC9B2
replicated across cohorts, with PP.H4 of 0.65 (Cohort 1) and 0.80 (Cohort 2) for PMF1, and 0.95 (Cohort 1) and 0.92
(Cohort 2) for SLC9B2, surpassing the high colocalization threshold of 0.75. The top SNP for SLC9B2 was rs11727498,
and the top SNP for PMF1 was rs2736611 (Figure 4D, E).
These results indicate high-confidence colocalization between the GWAS signal for TC and the regulatory signal for PMF1 and SLC9B2 at their respective loci, consistent with a shared causal variant. The pattern supports PMF1 and SLC9B2 expression as plausible mediators of the observed TC association within these regions.
Figure 4. Prioritization of putative susceptibility genes for TC. (A-B) Volcano plots summarizing SMR associations between cis-eQTL-regulated gene expression and TC risk in Cohort 1 (A) and Cohort 2 (B). The x-axis denotes SMR effect size (OR) and the y-axis -log10(P_SMR). (C) Colocalization results at candidate loci across both cohorts, indicating the posterior probability of a shared causal variant (PP.H4) according to the thresholds specified in Methods. FAM22D and MKI67IP showed reportable SMR associations after quality control but yielded no evaluable colocalization results; accordingly, they are not displayed in panel C. (D-E) Regional SNP-level scatter/LD plots showing the correspondence between eQTL effects and TC GWAS effects for SLC9B2 in Cohort 1 (D) and PMF1 in Cohort 2 (E). Points are colored by LD (r²) with the lead variant; neighboring genes are displayed to provide genomic context.

Discussion
This study supports a modest but consistent causal effect of genetically predicted height on TC risk and nominates PMF1 and SLC9B2 as credible susceptibility genes by integrating MR, SMR, and colocalization evidence. The findings align with developmental and endocrine biology of growth, while highlighting mechanistic hypotheses that merit functional validation.
A European-ancestry two-sample MR analysis indicated a statistically significant, positive causal association between genetically proxied height and TC risk (OR 1.38 per exposure unit, typically one SD of height; p<0.05), thereby rejecting the null hypothesis at the 5% significance level. This direction and magnitude are consistent with conventional observational evidence; for example, a meta-analysis of American and Dutch cohorts reported a 13% increase in TC risk per 5 cm of height [43] and a large Korean cohort observed a 9% increase in overall cancer hazards per 5 cm, with one of the strongest site-specific associations for TC[44]. The present estimates offer a more credible causal interpretation because MR is less susceptible to residual confounding and reverse causation than standard observational designs. Under the core instrumental-variable assumptions, the IVW estimate remained robust after MR PRESSO and a suite of sensitivity analyses, including methods with stronger resistance to pleiotropy. A random-effects meta-analysis further strengthened the reliability of the association. This multi-method strategy enhances confidence in the findings and helps explain inconsistencies in the literature. For instance, one MR analysis based on 5,518 TC cases and 19,055 controls reported no association[6], a discrepancy plausibly attributable to differences in data quality, population heterogeneity, and methodological choices. It is important to note that the reported association reflects a relative risk increase; given the low baseline incidence of TC, the absolute risk elevation remains modest. Although height is not a modifiable target, it provides etiologic insight and can contribute to risk stratification.
Mechanistic considerations linking height to TC risk remain incompletely resolved, yet several coherent hypotheses emerge from our data and prior biology. Taller individuals likely have a greater number of susceptible cells, which increases opportunities for malignant transformation[45]. Endocrine correlates of stature, notably growth hormone and insulin-like growth factor 1 (IGF1), exert mitogenic and anti-apoptotic effects through PI3K–AKT and MAPK cascades, plausibly elevating baseline oncogenic signaling[46]. Height-associated variants may also reside in LD with loci that influence cancer susceptibility, providing an alternative genetic conduit for risk[47, 48].
Pathway enrichment in this study converges on a height-chondrogenesis-ECM-TGF-β/SMAD-endocrine axis that plausibly shapes the testicular germ-cell niche across fetal and pubertal windows. Within this axis, the insulin/IGF system is essential for late-fetal and neonatal Sertoli-cell proliferation and ultimately determines adult testicular capacity[49, 50]; perturbation of insulin/IGF signaling diminishes testis size and sperm output, underscoring a developmental bottleneck with downstream implications for carcinogenesis[51]. In parallel, ECM components-including collagen-rich matrices and microfibrils- and SMAD complexes point to fibrillin-1-mediated control of latent TGF-β bioavailability. This mechanism fine-tunes local proliferative and survival cues[52, 53]. Given that TC often originates as in-utero germ cell neoplasia in situ and progresses under pubertal hormonal surges with niche remodeling, the convergence of endocrine tone and ECM-TGF-β coupling provides a biologically credible route by which genetic liability to height increases the conditional probability of malignant progression[54]. While these observations offer a unifying framework, targeted functional and longitudinal studies are needed to define the specific mediators and developmental windows that causally bridge height biology to TC risk.
In the SMR framework, a significant p_SMR indicates an instrumented association between the phenotype and gene expression; when accompanied by a non-significant HEIDI test and high PP.H4 from colocalization, the evidence more convincingly excludes horizontal pleiotropy and distinct nearby causal variants, strengthening coherence along the proposed causal chain. Population genetics and functional inference evidence support PMF1 (rs2736611) and SLC9B2 (rs11727498) as credible TC susceptibility genes, consistent with the present SMR and colocalization signals. PMF1 at 1q22 has been repeatedly noted in testicular germ cell tumor (TGCT) genome-wide analyses and reviews, within risk categories enriched for microtubule and chromosome assembly-domains in which PMF1 is highlighted alongside TEX14 and related cytoskeletal regulators[55]. Recent large-scale meta-analytic syntheses further list PMF1 among genes with moderate-to-high likelihood of TGCT involvement, aligning with pan-cancer resources that report PMF1 expression, while underscoring the need for TC-specific, compartment-resolved validation[56].
SLC9B2 (NHA2), a mitochondrial Na+/H+ exchanger that governs pH and apoptotic tone, sits within the broader NHE family implicated in tumor proliferation and prognosis[57]; locus-level fine-mapping places TGCT credible variants upstream of SLC9B2, supporting overlap between disease association and regulatory terrain[58]. An early negative report in testis homogenates predates cell–type–resolved profiling and does not exclude testis- or tumor-compartment-specific regulation at this locus[59]. Together, convergent GWAS synthesis (PMF1), credible-set overlap (SLC9B2), and ion homeostasis biology (NHA2) provide a coherent rationale for mechanistic follow-up, with priorities including single-cell testis datasets and perturbation studies in seminoma and non-seminoma models.
Several limitations warrant consideration when interpreting these findings. The MR framework estimates causal effects between genetically proxied height and TC risk, yet confirmation of causality benefits from triangulation across study designs, including longitudinal cohorts, quasi-experiments where feasible, and expanded multi-ancestry GWAS resources to strengthen external validity. The analytic sample derives predominantly from European populations, which constrains generalizability; replication in non-European ancestries is essential to address allele frequency and LD differences and assess effect size transportability. Pathway enrichment is hypothesis-generating rather than confirmatory and has not been validated by targeted functional or longitudinal studies. Testis- and cell type-resolved eQTL/pQTL datasets, single-cell transcriptomics, and perturbation assays will be required to establish whether the highlighted endocrine-ECM-TGF-β/SMAD programs operate in the relevant germ cell and Sertoli cell compartments in vivo. The primary analyses assumed a linear exposure-response between height liability and risk; potential non-linear or threshold effects, developmental timing, and gene-environment interactions should be explored in future work to refine risk modeling. The susceptibility genes and loci identified through SMR and colocalization nominate plausible targets but remain provisional. Model choices in SMR/colocalization (priors, windows, single- vs multi-causal architectures) can influence posterior evidence. Fine-mapping with credible sets, cross-ancestry replication, molecular validation-CRISPR perturbation, allelic reporter assays, and orthogonal proteogenomic readouts are necessary to establish causality and evaluate the translational potential of these candidates.
Conclusion
This work implicates height as a causal risk factor for TC. It highlights PMF1 and SLC9B2 as convergent susceptibility candidates, providing testable targets for tissue-specific functional validation and future risk stratification frameworks.
Abbreviations
Bayesian Weighted Mendelian Randomization: BWMR; Con-tamination Mixture method: Con_mix; Constrained Maximum Likelihood and Model Averaging: Con_ML; Confidence Interval: CI; Debiased Inverse-Variance Weighted: dIVW; Expression quantitative trait loci: eQTL; Extracellular matrix: ECM; Gene Ontology: GO; Genome-wide association studies: GWAS; Inverse-Variance Weighted: IVW; Instrumental variables: IV; Kyoto Encyclopedia of Genes and Genomes: KEGG; Linkage disequilibrium: LD; Mendelian Randomization: MR; Mende-lian Randomization Pleiotropy RESidual Sum and Outlier: MR-PRESSO; Odds ratio: OR; Robust adjusted profile score: RAPS; Standard Error: SE; Single nucleotide polymorphisms: SNP; Summary-data-based Mendelian Randomization: SMR; Testicular germ cell tumor: TGCT; Testicular cancer: TC.
Supplementary Materials
Declarations
Author contributions
Yuangao Xu conceived the study; Yuanbo Xu, Jieyu Xiong and Yikun Wu acquired and curated the data and performed all analyses; Yuanlin Wang, Hua Shi and Shuxiong Xu provided es-sential resources and supervised the experimental campaign; Yuanbo Xu, Jieyu Xiong and Yuangao Xu drafted the initial manuscript, Yuangao Xu critically revised and finalized the manuscript. All authors contributed to the interpretation of the data, iteratively refined the manuscript with substantive feed-back, and have read and approved the final version for publica-tion.
Acknowledgements
We thank the IEU Open GWAS Project for providing summary results and data essential for our analyses, available at https://gwas.mrcieu.ac.uk/datasets/. We also want to acknowledge the participants and investigators of the FinnGen and UK Bio-bank studies.
Funding information
This work was supported by a grant from the 2021 National Natural Science Foundation Post Subsidy Individual Fund of China with reference GPPH-NSFC-2021-10, and the Science and Technology Fund of the Guizhou Health Commission, identified by the grant number gzwkj2021-212.
Ethics approval and consent to participate
Not Applicable.
Competing Interests
The authors declare that they have no existing or potential commercial or financial relationships that could create a con-flict of interest at the time of conducting this study.
Data availability
Not Applicable.
References
 Figures
 References
 Peer
Peer Information
Figure 1. An outline of the study's approach. Utilizing a bidirectional Mendelian randomization framework. SNP: single nucleotide polymorphism, IVW: Inverse-variance weighted method, dIVW: debiased inverse-variance weighted method, RAPS: Robust adjusted profile score, Con_ML: constrained maximum likelihood and model averaging, Con_Mix: contamination mixture, BWMR: Bayesian weighted Mendelian randomization, MRPRESSO: Mendelian Randomization Pleiotropy RESidual Sum and Outlier.
Figure 2. Causal effect of genetically proxied height on TC risk. (A) Forest plots of two-sample MR estimates from two independent cohorts. IVW and MR-PRESSO are prespecified primary estimators; RAPS, dIVW, Con_ML, ConMix, and BWMR serve as sensitivity analyses. Effect sizes are OR for TC per 1 SD increase in genetically predicted height with 95% CI; OR > 1 indicates higher risk. (B) Random-effects meta-analysis pooling cohort-specific IVW estimates. The pooled effect is reported as OR with 95% CI and two-sided P value. Between-cohort heterogeneity was evaluated using Cochran’s Q; P_heterogeneity > 0.05 indicates no material heterogeneity.
Figure 3. Functional enrichment of height-TC-associated genes. The enrichment analysis using clusterProfiler identified significant terms in (A) GO Biological Process, (B) GO Cellular Component, (C) GO Molecular Function, and (D) KEGG pathways. Dots encode term size (Count) and adjusted significance, x-axis shows EnrichmentScore=−log10(p). Terms shown are the top 10 per panel after filtering at p.adjust<0.05 and, where applicable, semantic similarity trimming.
Figure 4. Prioritization of putative susceptibility genes for TC. (A-B) Volcano plots summarizing SMR associations between cis-eQTL-regulated gene expression and TC risk in Cohort 1 (A) and Cohort 2 (B). The x-axis denotes SMR effect size (OR) and the y-axis -log10(P_SMR). (C) Colocalization results at candidate loci across both cohorts, indicating the posterior probability of a shared causal variant (PP.H4) according to the thresholds specified in Methods. FAM22D and MKI67IP showed reportable SMR associations after quality control but yielded no evaluable colocalization results; accordingly, they are not displayed in panel C. (D-E) Regional SNP-level scatter/LD plots showing the correspondence between eQTL effects and TC GWAS effects for SLC9B2 in Cohort 1 (D) and PMF1 in Cohort 2 (E). Points are colored by LD (r²) with the lead variant; neighboring genes are displayed to provide genomic context.
Peer-review Terminology
Identity transparency: Single anonymized
Reviewer interacts with: Editor
Review information published:
Review reports
Reviewer identities if reviewer opts in
Author/reviewer communication
Details
© 2025 The Author(s). Life Conflux published by Life Conflux Press Limited on behalf of Conflux Science.
This is an open access article under the terms of the Creative Commons Attribution License, which permits use, distribution and reproduction in any medium, provided the original work is properly cited.
Publication History
Received 2025-08-21
Accepted 2025-09-21
Published 2025-10-21