




Abstract
Background: This study investigated the effects of postoperative platelet-rich plasma (PRP) supplementation on skin flap survival in a rat model.
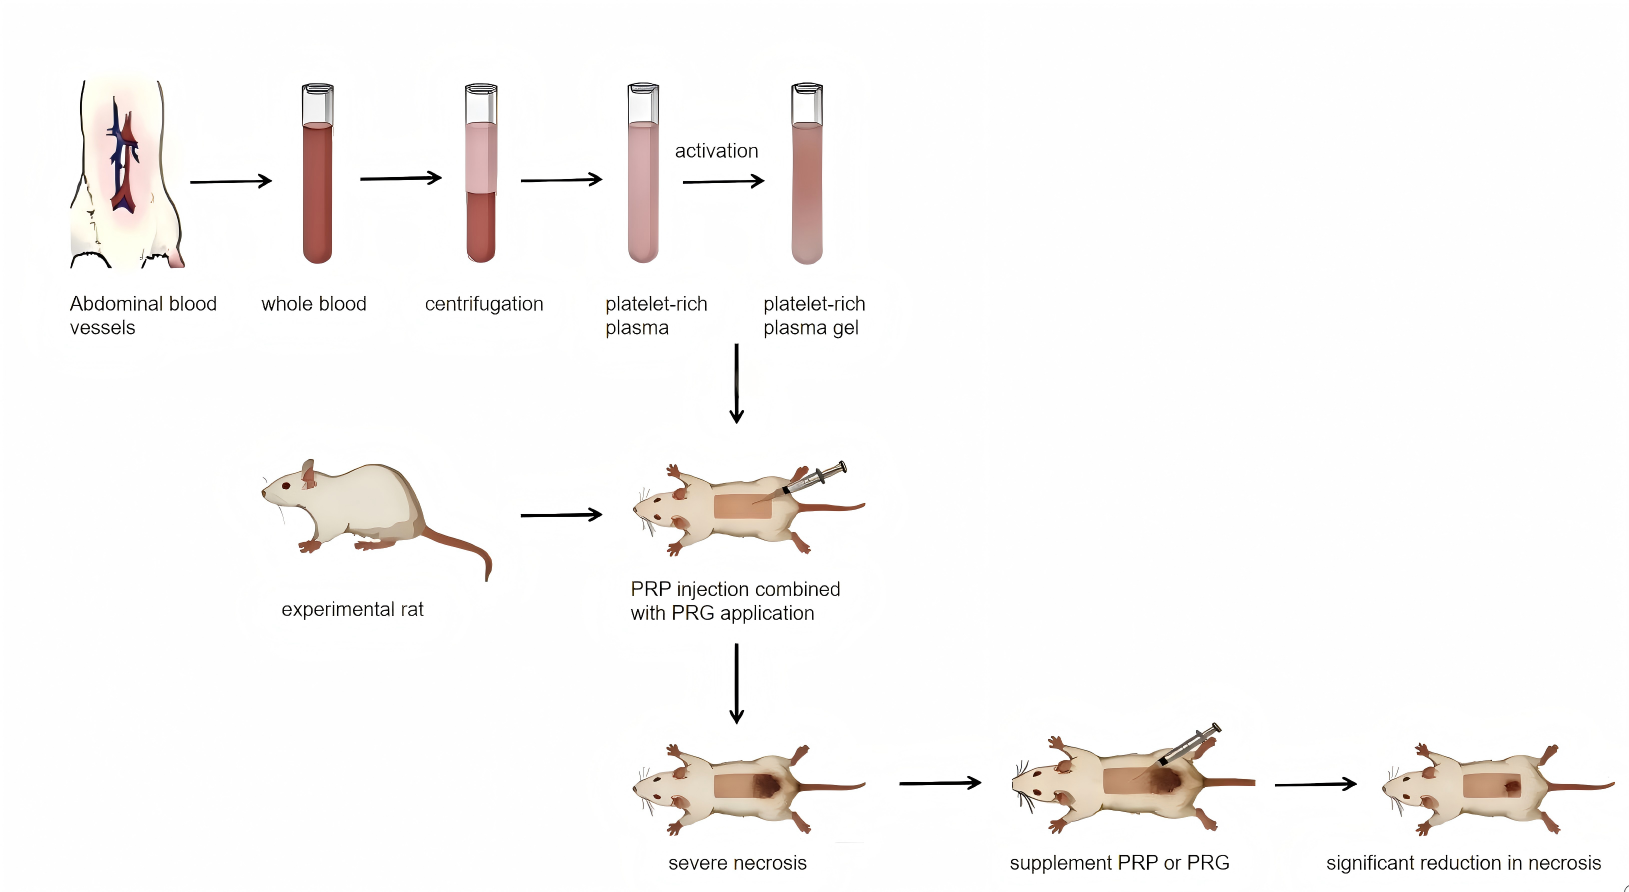
Methods: A random-pattern skin flap model was established in rats. During surgery, PRP injection combined with platelet-rich gel (PRG) application was performed. On postoperative day 3, PRP or PRG was supplemented into the flap via uniform point injections. Necrotic area was recorded at postoperative day 7. Flap defect length and terminal edema severity were assessed by contrast-enhanced ultrasonography. Tissue specimens were collected for histopathological and immunohistochemical analysis. Relative expression levels of vascular endothelial growth factor (VEGF), platelet-derived growth factor (PDGF), and cluster of differentiation 34 (CD34) were measured.
Results: The group receiving intraoperative PRP injection combined with PRG application, followed by postoperative PRG supplementation, showed significantly shorter tissue defect lengths and less terminal tissue edema compared to other groups (P<0.01). Relative expression levels of VEGF, PDGF, and CD34 were significantly higher than those in other groups (P<0.01).
Conclusion: Postoperative PRP and PRG supplementation reduced flap defect length and edema severity, increased growth factor expression, and improved flap survival. PRG supplementation produced the most pronounced benefits.
Keywords: free flap; Platelet-Rich Plasma Gel; Platelet-Rich Plasma; ultrasound contrast; VEGF; CD34
Introduction
Skin flap transplantation is commonly used for reconstructing extensive burn wounds and deep injuries secondary to trauma or congenital defects. However, persistent issues such as delayed wound healing and incomplete recovery after flap surgery have been observed [1,2]. Research indicates that poor wound healing is associated with growth factor deficiency, as these factors play a crucial role in wound repair. Platelet-rich plasma (PRP) and platelet-rich gel (PRG), both platelet-rich blood products, contain activated platelets that release multiple growth factors including vascular endothelial growth factor (VEGF). These factors synergistically promote cell proliferation, migration, and angiogenesis, providing multiple positive effects in wound healing and serving as an effective adjunctive therapy to improve outcomes for difficult-to-heal wounds post-skin flap surgery [3,4]. However, partial necrosis may still occur after PRP-injected skin flaps. To investigate this, the research team developed a rat model of free flap. During surgery, 50μl/cm² PRP was injected and 50μl/cm² PRG was applied. Postoperatively, an additional 100μl/cm² PRP or PRG was administered. The study aimed to determine whether postoperative PRP supplementation could further increase growth factor levels, and enhance flap survival probability, thereby providing new insights for clinical PRP therapy in treating non-healing wounds.
Experimental Animals and Related Methods
Experimental Animals
86 healthy SPF-grade SD female rats (7-8 weeks old, 200-230g) were used in this
study. 36 rats were allocated for experimental modeling, while 50 rats were used for PRP preparation. The rats were
procured from the Experimental Animal Center of Anhui Medical University (License: SYXK (Wan) 2022-001) and maintained
in a controlled environment with 20-28°C temperature and 45-75% humidity. Each cage contained four rats, with free
access to food and water. The experiment was approved by the Anhui Medical University Laboratory Animal Ethics
Committee (Approval No.: LLSC20252051).
Main Reagents and Instruments
80°C ultra-low temperature freezer, DW-HL5 purchased from Zhongke Meiling
Low-Temperature Technology; Excellent Low-Speed Benchtop Centrifuge, L3-5K purchased from Hunan Kecheng Instrument
Equipment Co., Ltd.; Ultrasound Diagnostic Instrument, ACUSON Sequoia purchased from Siemens Medical Systems Co.,
Ltd.; Ruiwode Enhanced Small Animal Anesthesia Machine, R540 purchased from Shenzhen Ruiwode Life Technology Co.,
Ltd.; Fully Automatic Blood Cell Analyzer, BC-5390 CRP purchased from Mindray Medical International Co., Ltd.;
High-Resolution Biological Microscope, DP74 purchased from Olympus. PDGF Antibody Reagents purchased from Hefei
Shanben Biotechnology. VEGF antibodies were procured from Affinity; CD34 antibodies from Protein Tech; calcium
gluconate injection from Sichuan Meidakanghua Pharmaceutical Co., Ltd.; and sulfur hexafluoride microbubbles for
injections from Bracco Suisse SA.
PRP and PRG Preparation
Two female SD rats were randomly selected from 50 SD rats. The anesthetized rats
were placed on the experimental table in supine position, and their limbs were fixed. The abdominal area was fully
exposed, and the skin was cut along the white line of the abdomen to expose the abdominal vein. The blood was
collected by a blood needle and 5ml of whole blood was taken. The whole blood was placed in 10% sodium citrate
anticoagulation tube.
The whole blood was centrifuged at 200g for 20 minutes, and the whole blood was divided into red blood cell layer,
white blood cell layer and plasma layer. Plasma and leukocyte layer were collected using a 1ml syringe, followed by a
second 200g centrifugation for 10 minutes. The supernatant (top 3/4) was discarded, and the remaining 1/4 was
homogenized to obtain plasma-rich plasma (PRP). Mix 1000 U of thrombin lyophilized powder with 1mL of 10% calcium
gluconate injection to prepare the activator. Then, mix PRP with the activator in a 10:1 ratio to obtain PRG. The
gel-like PRG is left undisturbed for 10-20 minutes until liquefaction, after which filtration yields the liquefied
PRG.
Collect 0.1ml of platelet-rich plasma in a sterile EP tube and perform platelet count using the BC-5390 CRP blood cell
analyzer. Ensure strict aseptic techniques throughout the procedure to prevent contamination.
Experimental Grouping
The experiment was divided into two parts: one group received 0.5ml saline injection
in the flap during operation, and the other group received 0.25ml PRP injection in the flap combined with 0.25ml PRG
application. After operation, the two parts received 0.5ml saline, 0.5ml PRP and 0.5ml PRG respectively. Rats were
randomly divided into six groups: N+N, N+P, N+G, PG+N, PG+P, and PG+G.
Model Design Concept
The dorsal skin of rats exhibits abundant blood supply, primarily supplied by three
arterial regions: the intercostal artery and lumbar artery in the central zone, the deep ilio-rotator artery in the
lateral zone, and the thoracodorsal artery in the scapular zone [5]. Our preliminary experiments
demonstrated that, given rats' rich subcutaneous vascular supply and strong repair capacity, even retaining a single
thoracodorsal artery as the primary donor would result in minimal necrotic area at the flap's distal end
postoperatively. Therefore, this study proposes a free flap model where major vessels are severed intraoperatively,
leaving only the dermis, subdermis, and microvascular network in the subcutaneous tissue for blood supply. This design
increases the distal necrotic area of the flap, facilitating postoperative evaluation of PRP's therapeutic effects.
Skin Preparation
Place the rats in a small animal anesthesia machine. After inducing anesthesia with 3.0%
isoflurane for 3 minutes, adjust the isoflurane concentration to 2.0%. Position the anesthetized rats prone on the
experimental table. Use a small razor to remove back hair, then apply an experimental animal depilatory agent to
eliminate residual hair roots. After thorough depilation, wipe off the depilatory agent with povidone-iodine to avoid
skin burns.
Flap Design and Procedure
A 1×5cm rectangular skin flap was designed on the back of the rats, with the
scapula as the pedicle. After routine disinfection and draping, the rat's skin and superficial fascia were incised
along the marked line. The superficial fascia was dissected from the deep fascia using a tissue dissection scissors,
and the flap was lifted in its entirety. The three major arteries supplying the flap were ligated to ensure the free
flap was obtained. Following complete hemostasis, 50μl/cm² of PRP injection and 50μl/cm² of PRG application were
performed at the flap base. The flap was then sutured in situ with 5-0 sutures, re-disinfected, and kept warm. Upon
recovery, the rats were housed individually in cages to prevent mutual tearing.
Postoperative Addition of PRP or PRG
On the third postoperative day, anesthetized rats were placed prone
on the experimental platform. Photographs were taken to record the necrotic area of the skin flap, which was then
analyzed using Image Pro Plus software to calculate the necrotic area. After routine disinfection and draping, 0.5 ml
of PRP was drawn with a 1ml syringe and uniformly injected as a spot at 1-2 mm from the flap edge. The other treatment
group received the same dose of liquid PRG, while the control group received the same dose of saline. After anesthesia
recovery, the rats were returned to their cages and continued under standard feeding conditions.
Ultrasound Contrast Imaging and Flap Sampling
On the seventh postoperative day, rats were anesthetized
again and photographed to document necrotic flap area. The images were analyzed using Image Pro Plus software to
calculate necrotic area. Rats were positioned supine on the experimental table, routinely disinfected, and gauze was
laid. One side of the jugular vein was isolated and punctured with a cannula, which was then sutured. A 0.5ml dose of
sulfur hexafluoride microbubble contrast agent was injected uniformly via the cannula, followed by ultrasound contrast
imaging guided by 10MHz ultrasound. Under contrast imaging, the length of the visual defect and the thickness of edema
at the flap margin were recorded. A small amount of whole blood was taken for platelet count before euthanizing the
rats for sampling. The samples were processed separately for pathological immunohistochemistry.
Immunohistochemistry
The mouse skin samples were embedded in paraffin to prepare white slides for HE
staining and immunohistochemical detection. HE staining was used to observe the gross morphology of tissues and
infiltration extent of inflammatory markers in sections. Immunohistochemical staining was employed to detect the
relative expression levels of VEGF and PDGF in tissues. Five randomly selected 400x field observations from each
well-processed slide were scored, with the final score calculated as the average of five evaluations. Positive results
were defined as brown-yellow or brown-brown staining particles localized to cytoplasm or cell membranes, with the
percentage of positive cells counted as a percentage of skin tissue cells. Scoring criteria were as follows: ①
Staining: No staining = 0 points; light yellow = 1 point; light brown = 2 points; brown-brown = 3 points. ② Positive
cell percentage: 0% = 0 points; 1%–24% = 1 point; 25%–49% = 2 points; 50%–74% = 3 points; 75%–100% = 4 points. ③ The
final score was determined by multiplying staining intensity by the percentage of positive cells. Statistical analysis
was performed on the final scores of each group.
Microvessel Counting
Under the CD34 immunostaining field magnified 400 times, 5 non-adjacent areas were
randomly selected for scoring. The number of microvessels was counted and averaged to determine the vascular density
of each sample. Statistical analysis was performed on the microvessel counts of rats in each group.
Statistical Methods
Statistical analysis was performed using SPSS software. Quantitative data conforming
to normal distribution were presented as mean ± standard deviation (X±s). One-way ANOVA was employed for inter-group
comparisons. For pairwise comparisons with homogeneous variances, the Bonferroni method was used. A P-value <0.05
was considered statistically significant.
Results
Platelet Count Analysis
Through statistical analysis of platelet counts in whole blood, intraoperative
PRP, and postoperative PRP from all groups: The platelet count in whole blood of all groups was (622.53±52.70)×10⁹/L,
with no significant intergroup differences (F=1.128; P=0.367). The platelet count in intraoperative PRP was
(2469.50±225.75)×10⁹/L, which was 3.966 times that of whole blood, with no significant intergroup difference (F=2.479;
P=0.139). The platelet count in postoperative PRP was (2287.81±168.65)×10⁹/L, which was 3.674 times that of whole
blood, with no significant intergroup difference (F=2.409; P=0.118) (Table 1).
Table 1. Platelet count in whole blood and PRP of rats in each group (X±s, 10⁹/L).
| Group | Number | Whole blood | Intraoperative PRP | Postoperative PRP |
|---|---|---|---|---|
| N+N | 6 | —— | —— | —— |
| N+P | 6 | 613.33±26.80 | —— | 2443.75±187.45 |
| N+G | 6 | 613.33±38.28 | —— | 2307.25±157.86 |
| PG+N | 6 | 655.33±51.86 | 2425.50±113.66 | —— |
| PG+P | 6 | 637.50±59.00 | 2644.50±30.23 | 2197.25±160.10 |
| PG+G | 6 | 622.50±49.68 | 2338.50±254.98 | 2203.81±55.43 |
| F | 1.128 | 2.479 | 2.409 | |
| P | 0.367 | 0.139 | 0.118 |
Note: Data are expressed as mean ± standard deviation (x±s), and one-way analysis of variance was performed. Bonferroni method was used for inter-group comparisons in this dataset. Statistical analysis showed no significant differences in platelet counts among the groups in whole blood, intraoperative PRP, and postoperative additional PRP. And PRP was not used at the horizontal line.
Contrast-enhanced Ultrasound
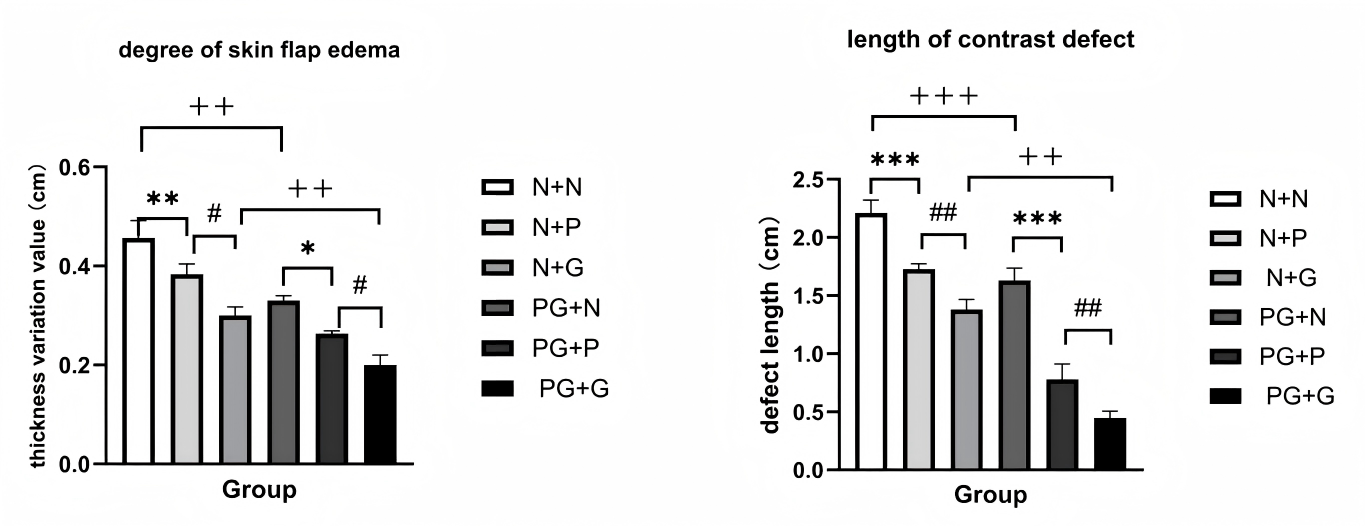
On the seventh postoperative day, contrast-enhanced ultrasound revealed no
significant differences in normal tissue thickness among all rat groups in this study (P>0.05). Measurements of
defect length and terminal edema in skin flaps showed that the PG+G group exhibited the smallest defect length and
lightest terminal edema compared to other groups (P<0.05) (Figure 1). Compared with the N+N
group, the N+P and N+G groups demonstrated significantly reduced terminal edema and defect severity (P<0.001). In
contrast, the PG+N group exhibited more pronounced terminal edema and defect severity than the PG+P group
(P<0.001), while the PG+G group showed marked improvement (P<0.05).
Figure 1. Comparison of flap edema degree and defect length on POD 7. Comparison of flap edema severity and defect length on postoperative day 7 in six groups of rats. Thirty-six rats were randomly divided into a saline group (n=18, treated with normal saline) and an experimental group (n=18, treated with PRP+PRG). On postoperative day 3, the rats were further subdivided into three groups: an additional saline group (n=6), an additional PRP group (n=6), and an additional PRG group (n=6). On postoperative day 7, flap edema severity and defect length were measured using contrast-enhanced ultrasound. Data were presented as mean ± standard deviation (SD). Statistical analysis was performed using One-way ANOVA. PRP: Platelet-rich plasma; PRG: Platelet-rich gel. *P<0.05 when comparing the additional PRP group; **P<0.01; ***P<0.001; #P<0.05 when comparing with the additional PRG group; #P<0.01; #P<0.001; +P<0.05 when comparing with the group receiving PRP combined with PRG during surgery, ++P<0.01; +++P<0.001. X-axis: Group N+N; Group N+P; Group N+G; Group PG+N; Group PG+P; Group PG+G. Y-axis: edema thickness of skin flap (cm); length of contrast defect (cm).
Flap Necrosis Status
On the third postoperative day, all rat groups exhibited varying degrees of necrosis
in the distal flap areas (Table 2). The PRP-treated group showed significantly reduced necrotic area
compared to the saline-treated group (P<0.05). By the seventh day, the PG+P and PG+G groups demonstrated
statistically significant reduction in necrotic area (P<0.001) compared to other groups. Notably, the N+P and N+G
groups showed marked necrosis reduction (P<0.001) relative to the N+N group, while the PG+P and PG+G groups also
exhibited decreased necrotic area (P<0.001) compared to the PG+N group. However, no significant difference was
observed between PG+P and PG+G groups (P>0.05), nor between N+P and N+G groups (P>0.05). These results indicate
that the saline-treated group showed further expansion of necrotic area by the seventh day, whereas the PRP or
PRG-treated groups maintained stable necrotic extent compared to the third-day baseline.
Table 2. The necrotic area of skin flaps (X±s, cm²).
| Group | Number | D3 | D7 |
|---|---|---|---|
| N+N | 6 | 3.37±0.27 | 4.01±0.19 |
| N+P | 6 | 3.31±0.19 | 3.34±0.17② |
| N+G | 6 | 3.39±0.29 | 3.28±0.16②③ |
| PG+N | 6 | 1.14±0.13⑤ | 2.68±0.26② |
| PG+P | 6 | 1.57±0.19⑤ | 1.60±0.17①② |
| PG+G | 6 | 1.31±0.24⑤ | 1.34±0.25①②④ |
| F | 131.479 | 166.698 | |
| P | <0.001 | <0.001 |
Note: Data are expressed as mean ± standard deviation (x±s), and one-way analysis of variance was performed. Bonferroni method was used for inter-group comparisons in this dataset. ① indicates P<0.001 compared to PG+N group; ② indicates P<0.001 compared to N+N group; ③ indicates P>0.05 compared to N+P group; ④ indicates P>0.05 compared to PG+P group; ⑤ indicates P<0.05 compared to N+N, N+P, and N+G groups.
HE Staining
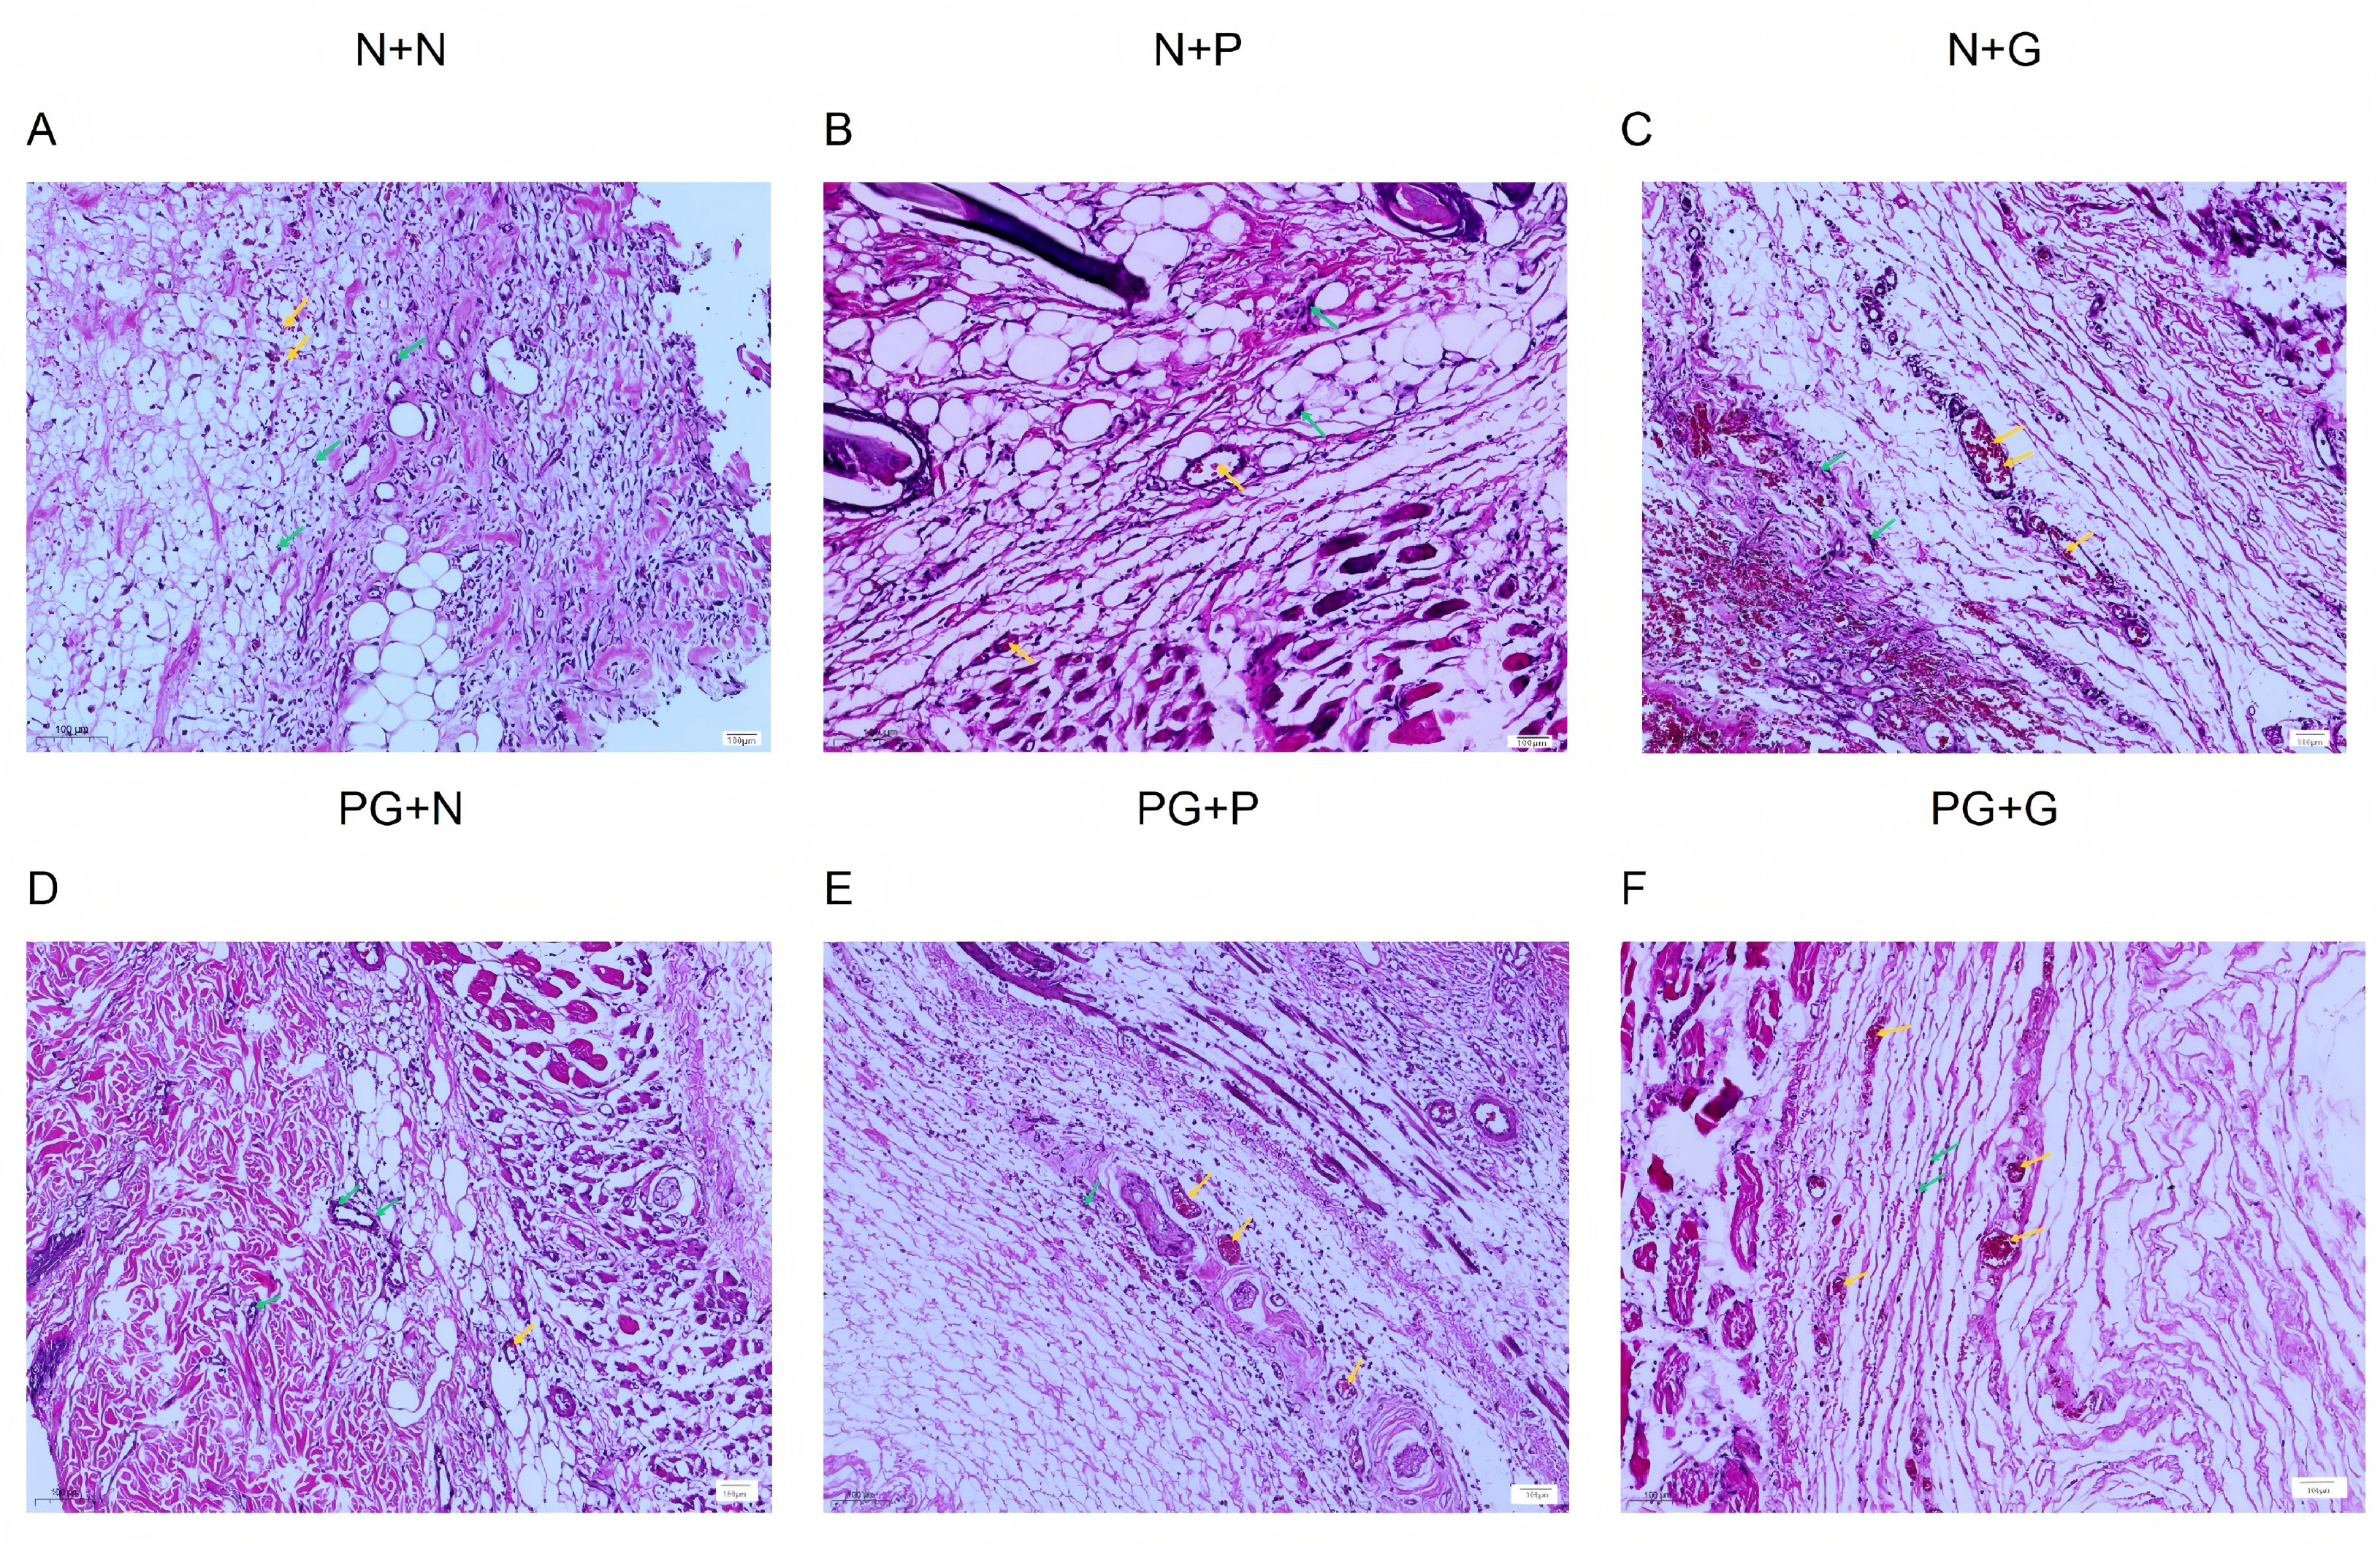
From HE staining of rat skin flaps postoperatively in all groups showed chronic inflammatory
cell infiltration and epidermal shedding in all flap tissues. The N+N group exhibited the most pronounced inflammatory
cell infiltration and epidermal shedding compared to other treatment groups (Figure 2A). In
contrast, PG+G and PG+P groups demonstrated significantly fewer inflammatory cells and reduced epidermal shedding,
with well-preserved epithelial cells (Figure 2E-F).
Figure 2. HE staining of rat skin flaps. HE staining was performed to observe the integrity of tissue sections, the extent of inflammatory cell infiltration, and the number of blood vessels. HE staining revealed randomly selected sections. In group N+N, extensive inflammatory cell infiltration, vascular congestion, and tissue necrosis were observed. Group N+P with added PRP and Group N+G with added PRG showed better preservation of cell morphology and an increased number of blood vessels. Compared to group PG+N and group PG+P, group PG+G exhibited better tissue morphology, milder inflammatory infiltration, and a higher number of blood vessels. Yellow arrows indicate blood vessels; Green arrows indicate inflammatory cell infiltration. Scale = 100 μm. HE staining: Hematoxylin-eosin staining.
Immunohistochemical Analysis
On the seventh postoperative day, immunohistochemical analysis was performed
on the rat skin flap specimens to detect the levels of growth factors including VEGF and PDGF. Results showed that:
Compared with the N+N group, all other treatment groups exhibited significantly increased expression levels of PDGF
and VEGF (P<0.05). Among the treatment groups with significant differences from the N+N group, the PG+G group
demonstrated notably higher expression levels of PDGF and VEGF compared to other groups (P<0.05) (Figure 3-5). Compared with the group receiving PRP postoperatively, all PRG groups
showed marked increases in growth factor levels. Specifically, the N+G group exhibited significantly higher expression
levels than the N+P group (P<0.05). The PG+G group showed significantly higher growth factor expression levels
compared to the PG+P group, while the PG+N group showed significantly lower levels than the PG+P group (P<0.05) (Table 3).
Figure 3. Immunohistochemical staining of VEGF in rat skin flaps. The relative expression levels of VEGF in tissues were detected by immunohistochemical staining. Five randomly selected sections with satisfactory staining were scored, and the final score was calculated as the average of the five scores. Positive results were defined as brown-yellow or brown-brown staining granules localized on the cytoplasm or cell membrane. The group receiving additional PRP or PRG showed a higher proportion of brownish-yellow areas and a higher final score. Scale = 20 μm. VEGF: vascular endothelial growth factor.
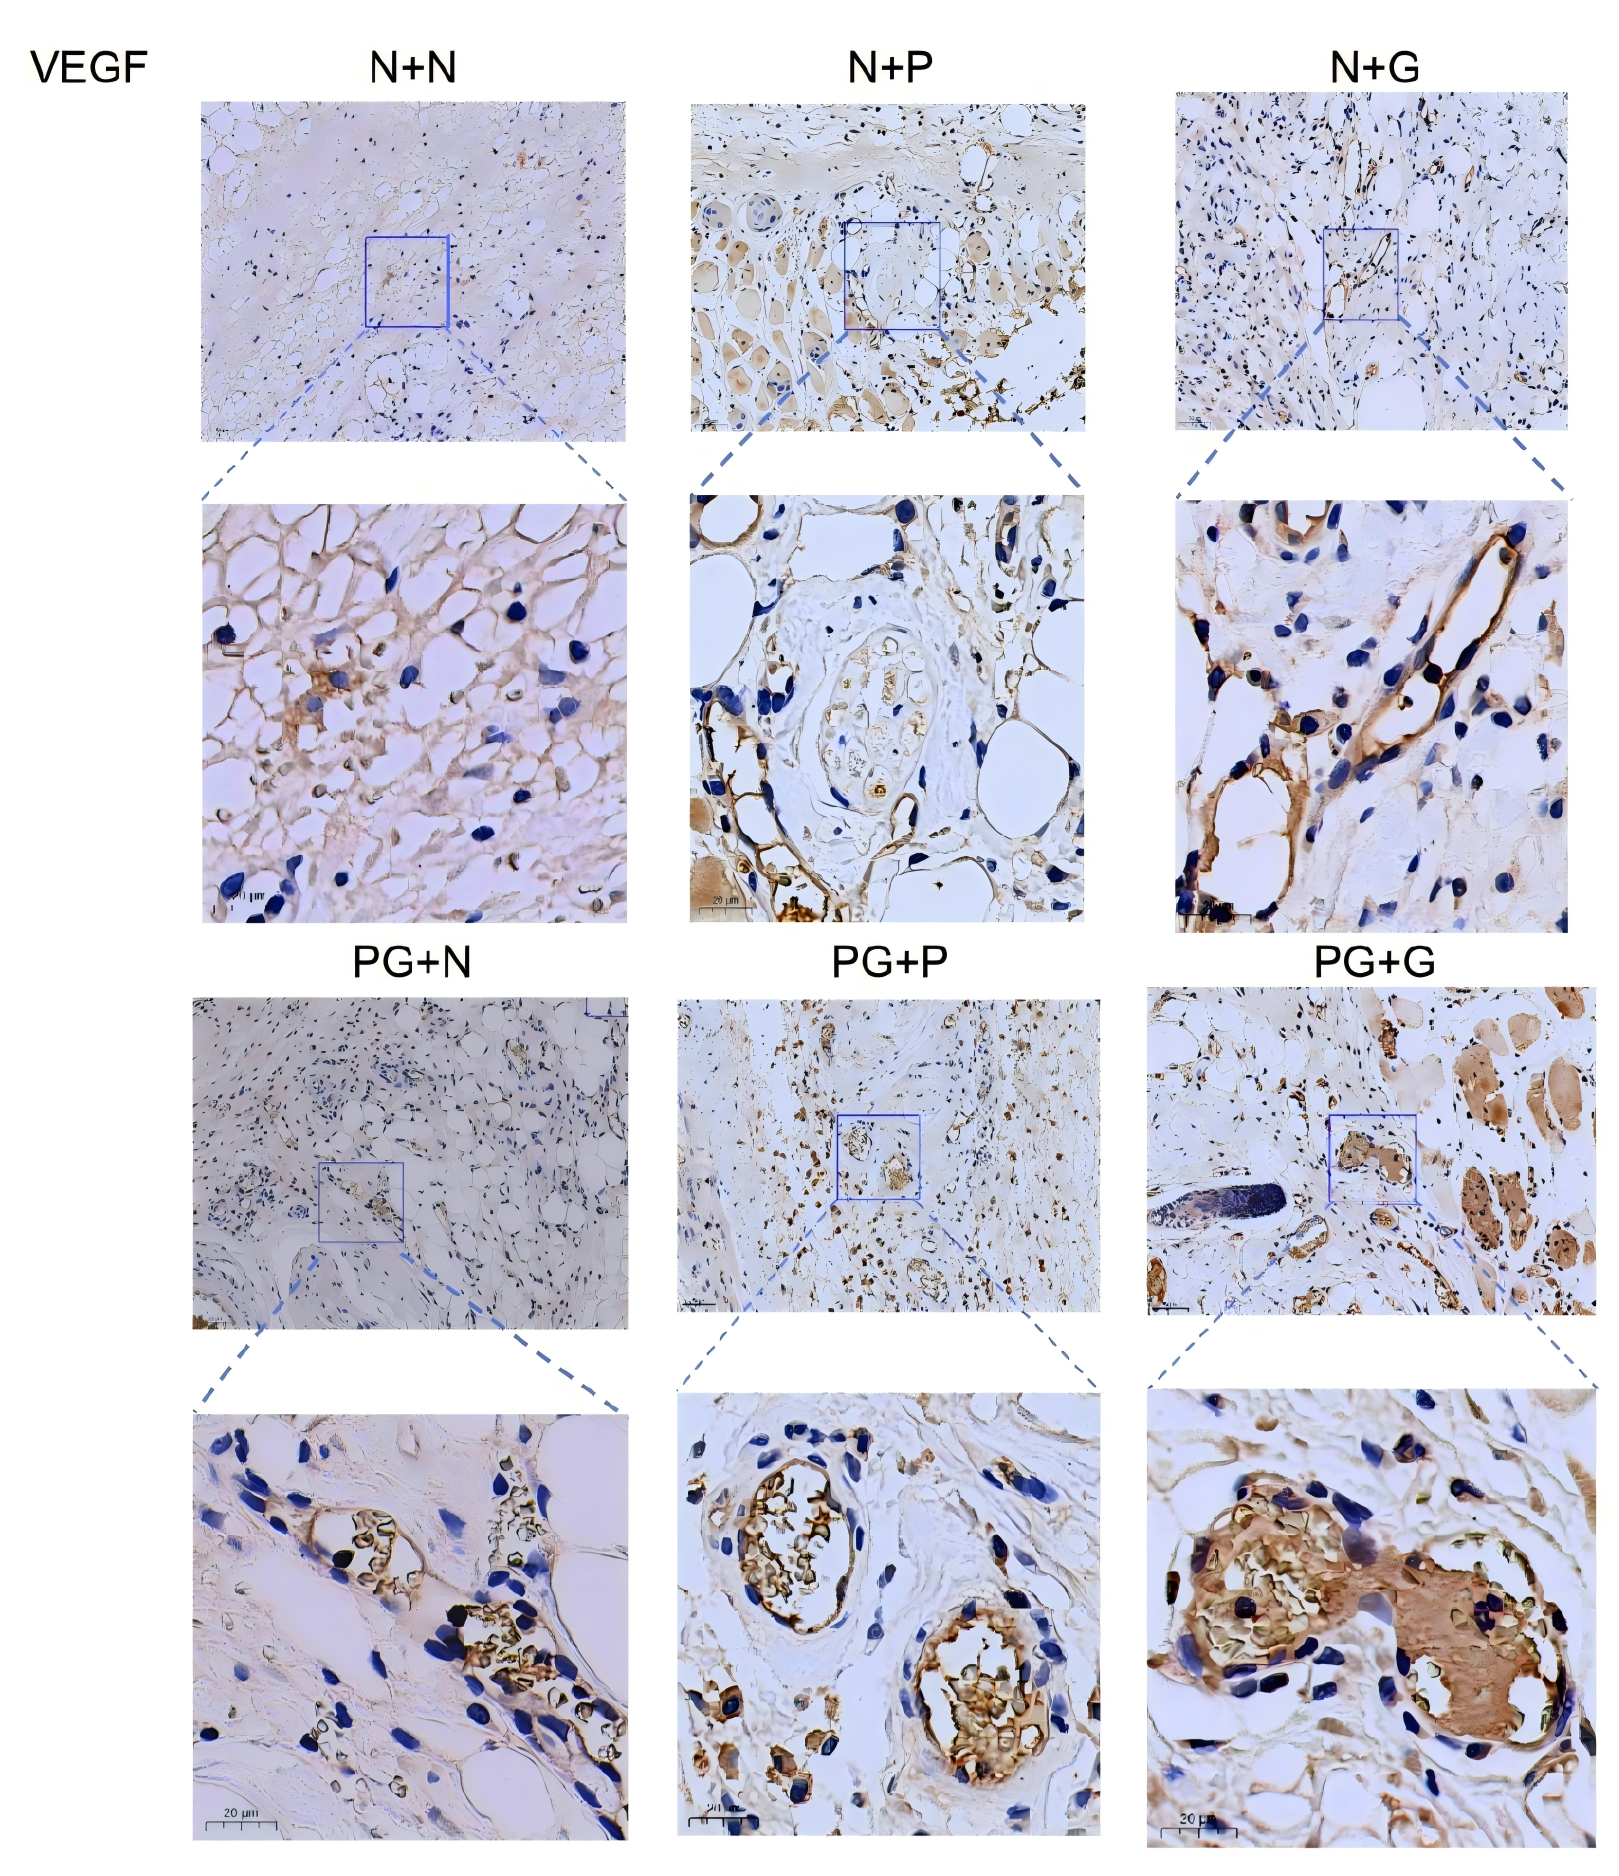
Figure 4. Immunohistochemical staining of PDGF in rat skin flaps. The relative expression levels of PDGF in tissues were detected by immunohistochemical staining. Five randomly selected sections with satisfactory staining were scored, and the final score was calculated as the average of the five scores. Positive results were defined as brown-yellow or brown-brown staining granules localized on the cytoplasm or cell membrane. The group receiving additional PRP or PRG showed a higher proportion of brownish-yellow areas and a higher final score. Scale = 20 μm. PDGF: platelet-derived growth factor.
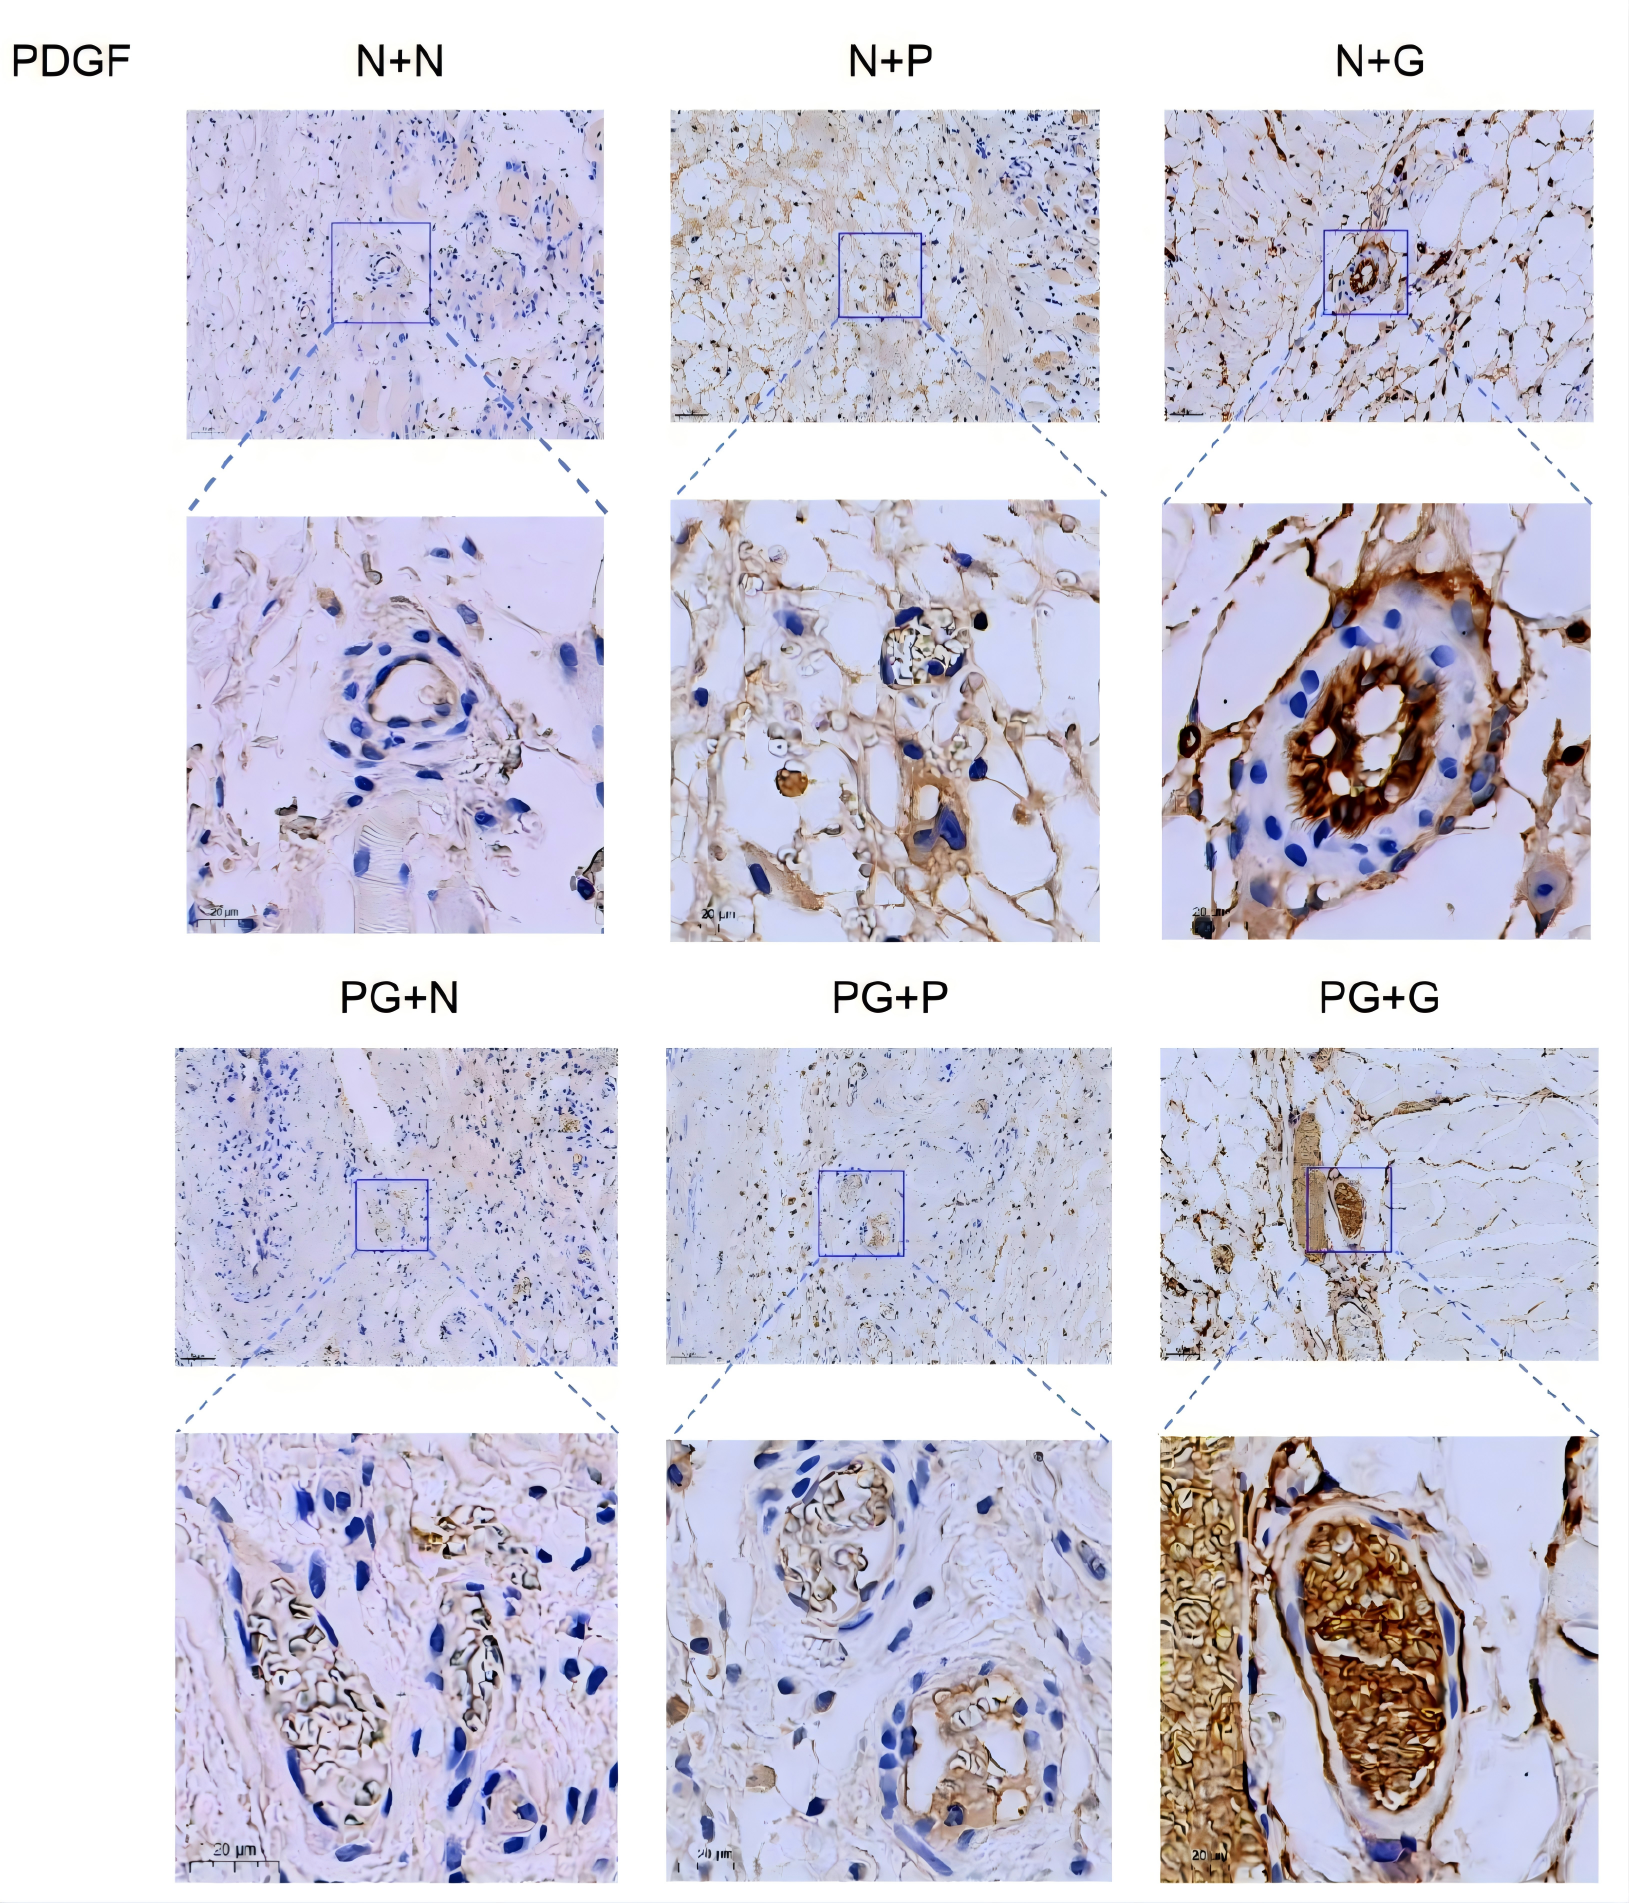
Figure 5. Relative expression levels of VEGF and PDGF. The relative expression levels of VEGF and PDGF in tissues were detected by immunohistochemical staining. Five randomly selected sections with satisfactory staining were scored, and the final score was calculated as the average of the five scores. Positive results were defined as brown-yellow or brown-brown staining granules localized on the cytoplasm or cell membrane. Data were presented as mean ± standard deviation (SD). Statistical analysis was performed using One-way ANOVA. VEGF: vascular endothelial growth factor; PDGF: platelet-derived growth factor. *P<0.05 when comparing the additional PRP group; **P<0.01; ***P<0.001; #P<0.05 when comparing with the additional PRG group; #P<0.01; #P<0.001; +P<0.05 when comparing with the group receiving PRP combined with PRG during surgery, ++P<0.01; +++P<0.001. X-axis: Group N+N; Group N+P; Group N+G; Group PG+N; Group PG+P; Group PG+G. Y-axis: relative quantity.
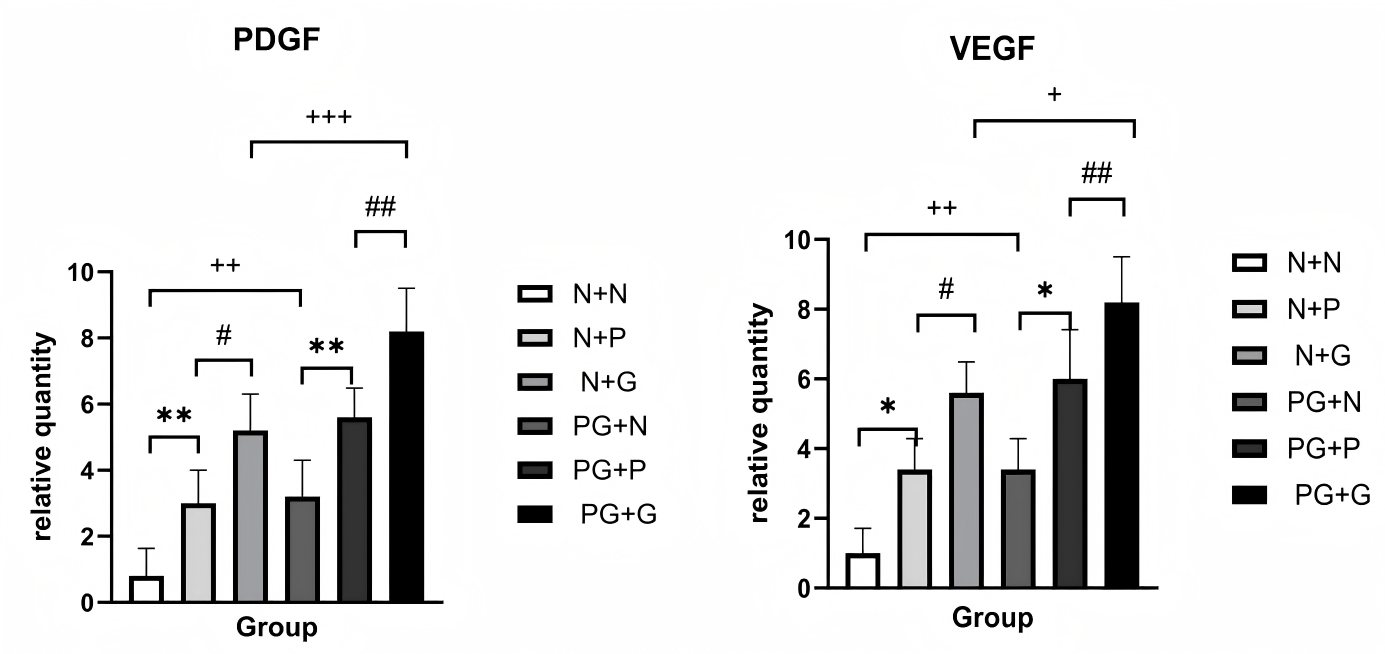
Table 3. Statistical table of immunohistochemical results (X±s).
| Group | Number | PDGF | VEGF | ||||
|---|---|---|---|---|---|---|---|
| Intensity | Percentage | Total | Intensity | Percentage | Total | ||
| N+N | 6 | 0.60±0.89 | 0.40±0.55 | 0.80±0.84 | 0.80±0.45 | 1.00±0.71 | 1.00±0.71 |
| N+P | 6 | 1.60±0.55 | 2.00±0.45 | 3.00±1.00② | 1.60±0.55 | 2.20±0.45 | 3.40±0.89② |
| N+G | 6 | 2.40±0.55 | 2.20±0.45 | 5.20±1.10③⑤ | 2.20±0.45 | 2.60±0.55 | 5.60±0.89③⑤ |
| PG+N | 6 | 1.80±0.45 | 1.80±0.45 | 3.20±1.10② | 1.60±0.55 | 2.20±0.45 | 3.40±0.89② |
| PG+P | 6 | 2.20±0.45 | 2.60±0.55 | 5.60±0.89④⑤ | 2.20±0.45 | 2.80±0.84 | 6.00±1.41④⑤ |
| PG+G | 6 | 2.80±0.45 | 3.00±0.71 | 8.20±1.30①④⑤ | 2.80±0.45 | 3.00±0.71 | 8.20±1.30①④⑤ |
| F | 29.867 | 28.873 | |||||
| P | <0.001 | <0.001 | |||||
Note: Data are expressed as mean ± standard deviation (x±s), and one-way analysis of variance was performed. Bonferroni method was used for inter-group comparisons in this dataset. ① indicates P<0.05 compared to PG+P group; ② indicates P<0.05 compared to N+N group; ③ indicates P<0.05 compared to N+P group; ④ indicates P<0.05 compared to PG+N group; ⑤ indicates P<0.001 compared to N+N group.
Microvessel Count Analysis
Microvessel counts were determined through CD34 detection. Compared with other
groups, the PG+G group showed a significantly higher number of microvessels (P<0.001). All other treatment groups
exhibited statistically significant increases in microvessel count compared to the N+N group (P<0.05) (Figure 6-7). The N+G group demonstrated a significantly higher microvessel count
than the N+P group (P<0.05), while the PG+P group showed a markedly higher count than the PG+N group (P<0.01)
(Table 4).
Figure 6. CD34 staining results. Under the background of CD34 staining, 5 non-adjacent areas were randomly selected for scoring. The number of microvessels was counted and averaged to determine the vascular density of each sample. The stained sections revealed that the group supplemented with PRP and PRG exhibited a higher number of microvessels. CD34: colony differentiation antigen 34.
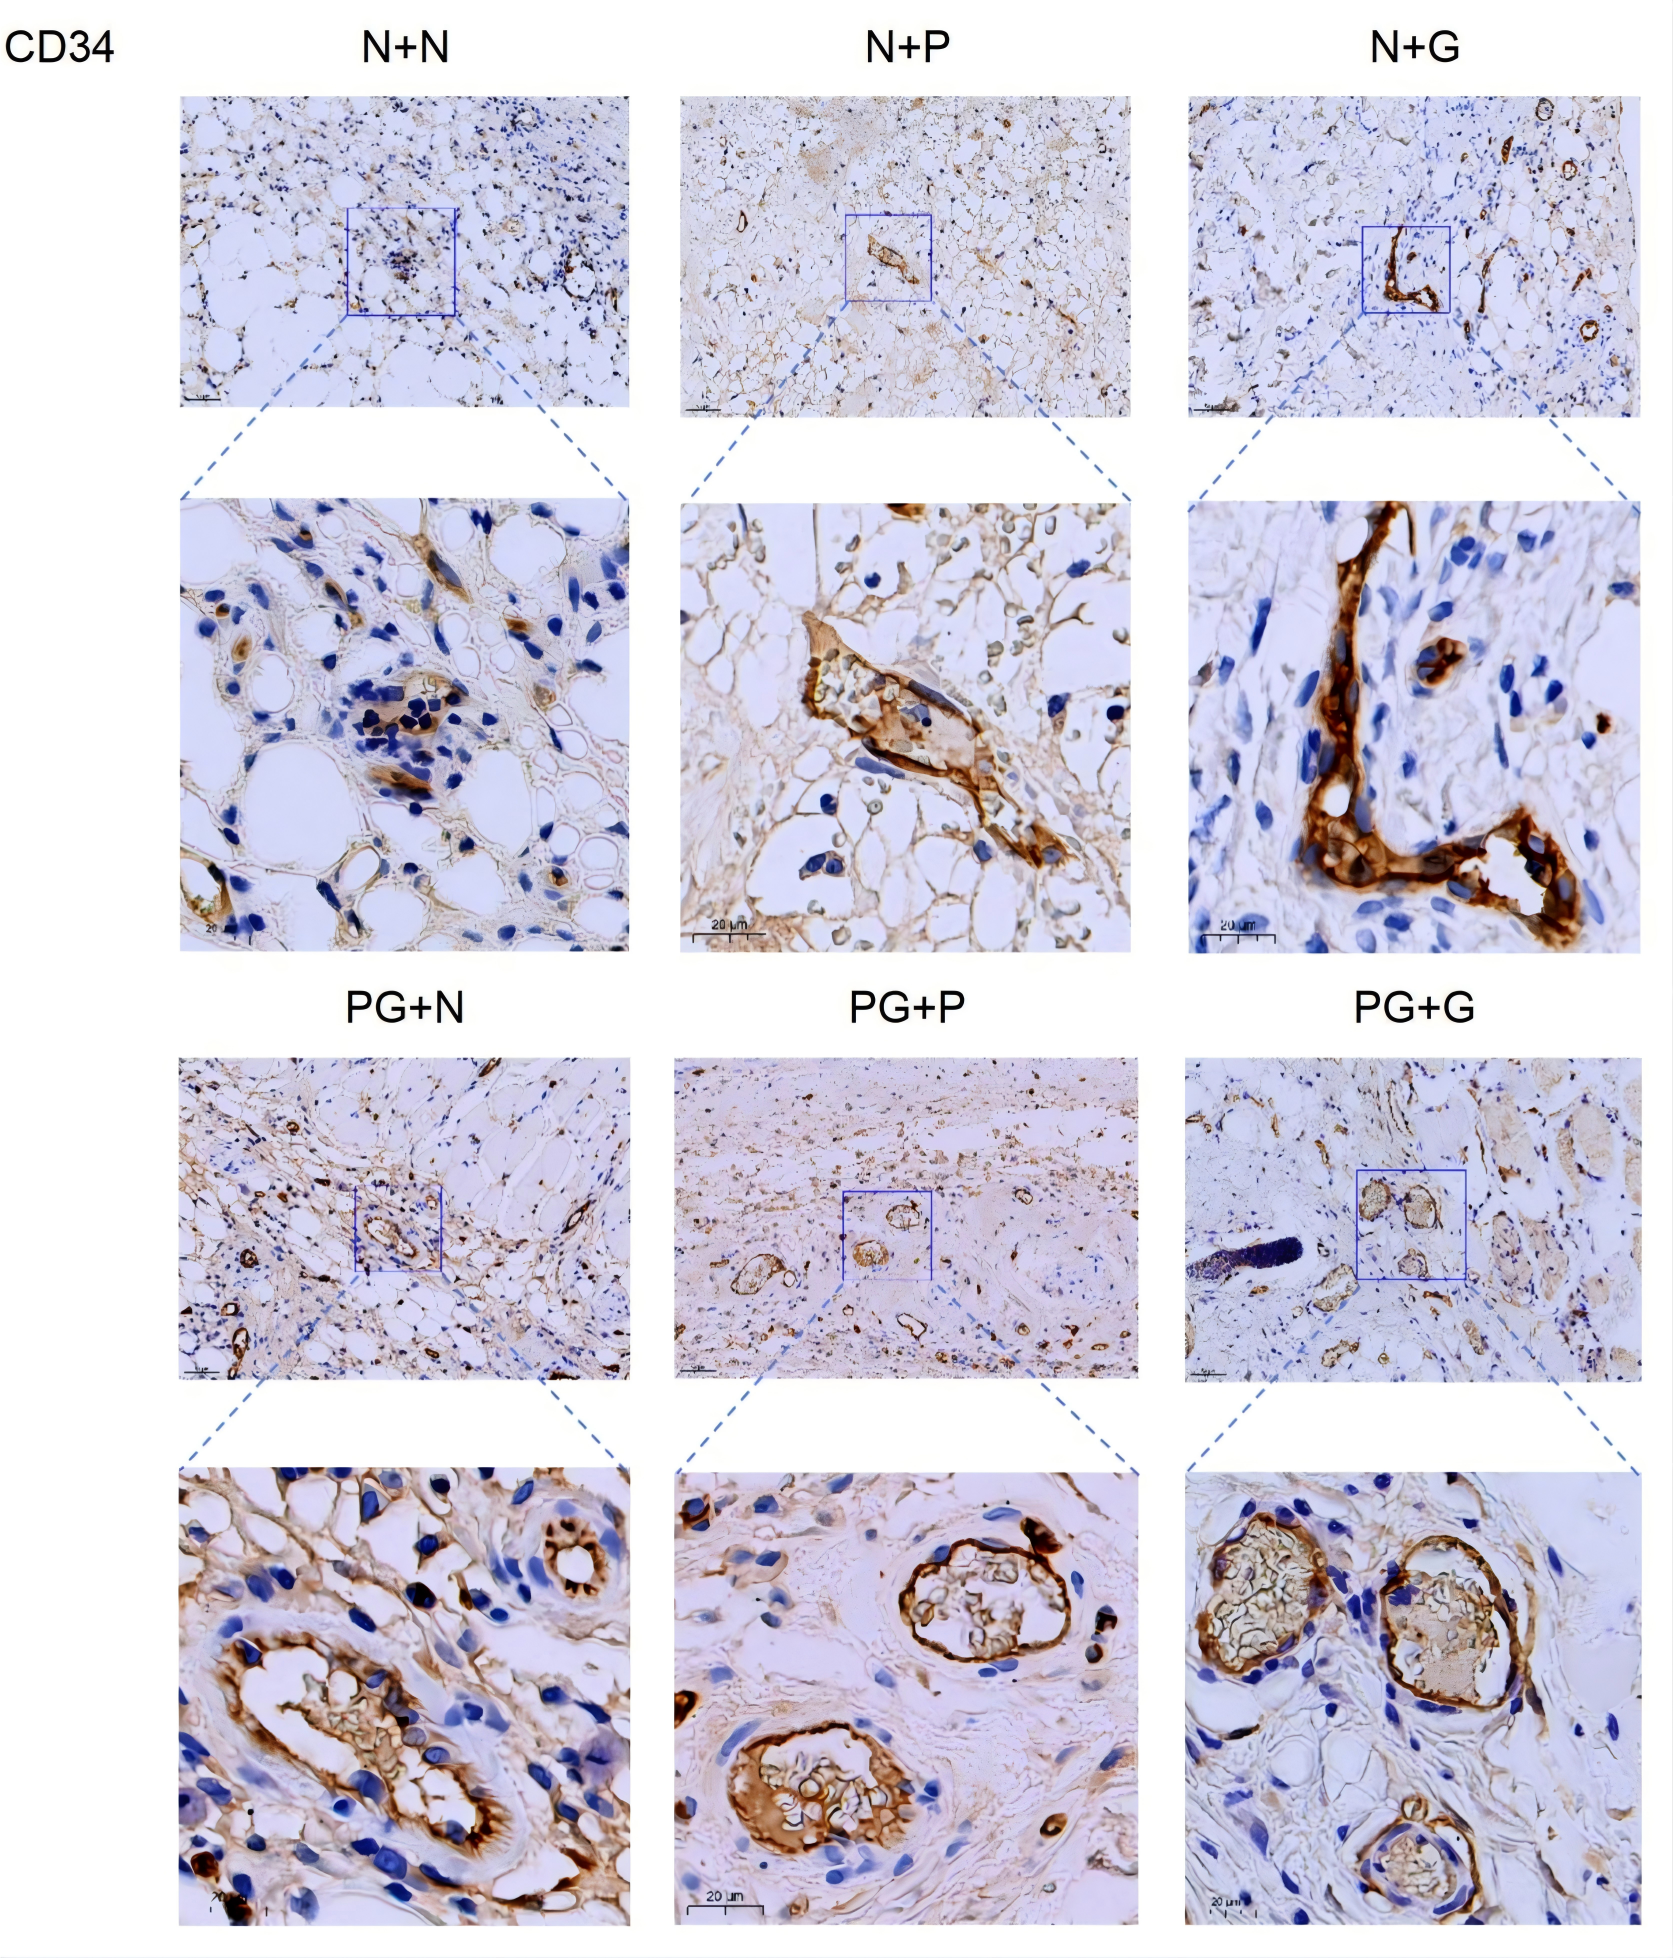
Figure 7. Microvessel Counting. Microvessel density (MVD) was expressed as the number of CD34-positive vessels per high-power field under light microscopy, with 5 randomly selected fields counted per slide. Data were presented as mean ± standard deviation (SD). Statistical analysis was performed using One-way ANOVA. *P<0.05 when comparing the additional PRP group; **P<0.01; ***P<0.001; #P<0.05 when comparing with the additional PRG group; #P<0.01; #P<0.001; +P<0.05 when comparing with the group receiving PRP combined with PRG during surgery, ++P<0.01; +++P<0.001. CD34: colony differentiation antigen 34; MVD: Microvessel density. X-axis: Group N+N; Group N+P; Group N+G; Group PG+N; Group PG+P; Group PG+G. Y-axis: relative quantity.
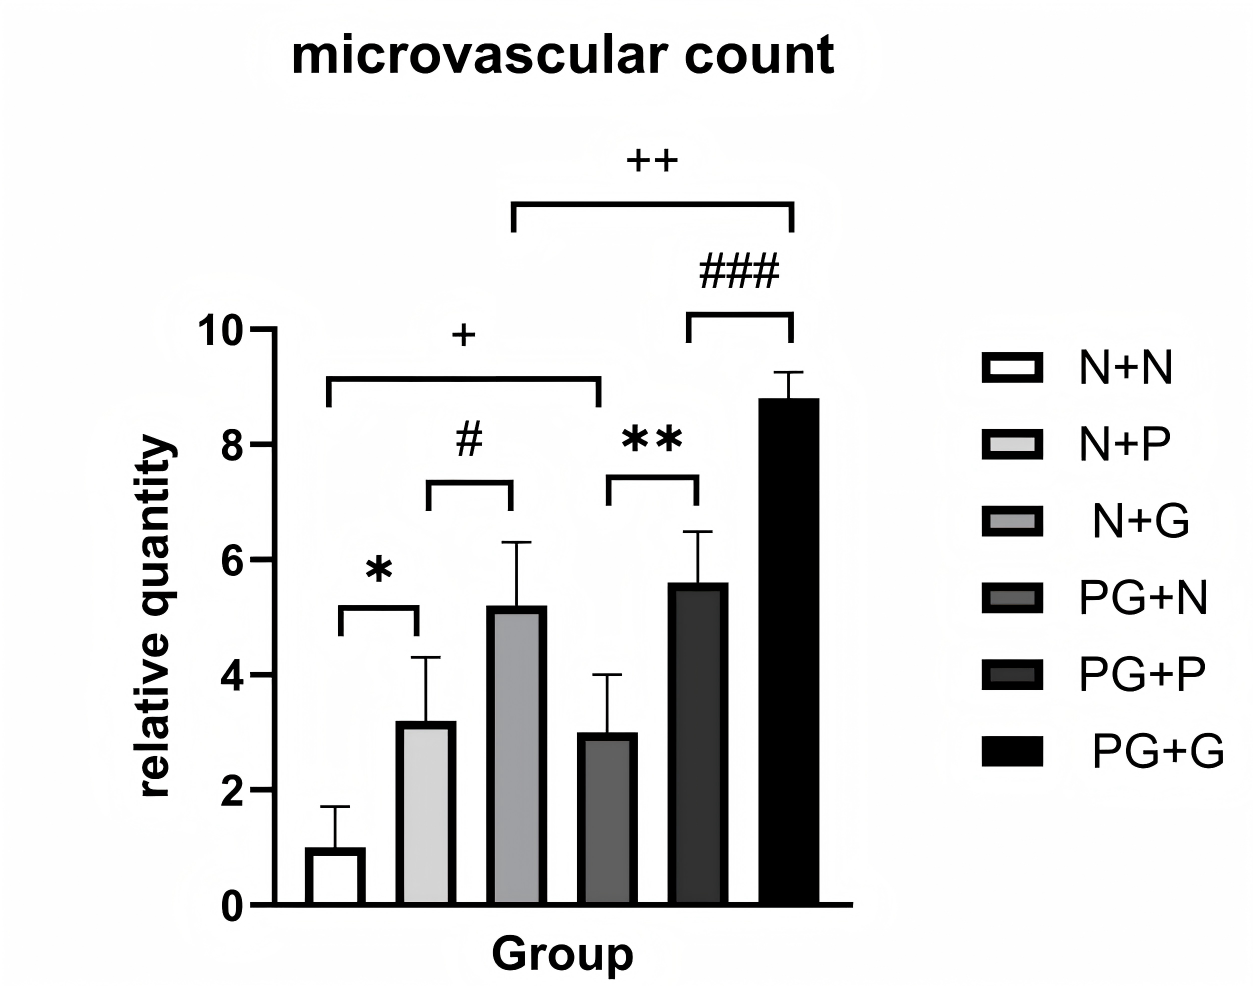
Table 4. Statistical table of microvascular count results (X±s).
| Group | Number | Microvascular Count |
|---|---|---|
| N+N | 6 | 1.00±0.71 |
| N+P | 6 | 3.20±1.10② |
| N+G | 6 | 5.20±1.10①③ |
| PG+N | 6 | 3.00±1.00② |
| PG+P | 6 | 5.60±0.89①④ |
| PG+G | 6 | 8.80±0.45①⑤ |
| F | 44.539 | |
| P | <0.001 |
Note: Data are expressed as mean ± standard deviation (x±s), and one-way analysis of variance was performed. Bonferroni method was used for inter-group comparisons. ① indicates P<0.001 compared to N+N group; ② indicates P<0.05 compared to N+N group; ③ indicates P<0.05 compared to N+P group; ④ indicates P<0.01 compared to PG+N group; ⑤ indicates P<0.001 compared to PG+P group.
Discussion
A random flap is a localized skin flap primarily supplied by the dermal layer, subdermal layer, and microvascular network within subcutaneous tissue, excluding dominant axial cardiovascular structures or large-caliber arteries with accompanying veins [6]. Due to unstable blood supply and limited perfusion range, the distal portion of such flaps is prone to ischemic necrosis [7]. Historically, it was believed that maintaining fixed length-to-width ratios was essential for achieving high flap survival rates. However, with advancements in anatomy, Milton et al. designed flaps with varying length-to-width ratios on pig backs—though all sharing the same blood supply base—revealing that flap survival depends not on specific ratios but on the underlying vascular supply [8]. This groundbreaking conclusion challenged the rigid constraints of fixed length-to-width ratios in random flaps. Rat dorsal skin is primarily supplied by three parallel vascular networks: the central region, fed by the posterior perforating branches of the intercostal and lumbar arteries, serves as the primary blood supply source; the lateral region is supplied by the deep ilio-rotator artery; and the scapular region by the thoracolumbar artery [5]. This three-zone vascular "map" provides an anatomical basis for experimental design of random flaps. Additionally, the necrotic areas in rat flaps remain stable and can be precisely quantified using Image Pro Plus to calculate necrosis percentages, ensuring objective and reliable data. Based on these principles, the research team developed a rat model for random flap experiments, surgically isolating the axial cardiovascular structures within the region while preserving only the dermal layer and subcutaneous microvascular network to induce distal necrosis, with necrosis areas analyzed using Image Pro Plus software.
The essence of skin flap healing lies in establishing new blood supply and completing tissue repair under ischemic conditions. In the early postoperative period, the flap's blood supply is entirely dependent on the pedicle. Flaps distant from the pedicle experience ischemia and hypoxia due to inadequate blood perfusion, leading to lactic acid accumulation, cellular acidosis, reduced ATP production, and insufficient cellular energy supply [9]. As platelets aggregate and activate, temporary stromal formation releases inflammatory factors, initiating the inflammatory response. Excessive neutrophil activation, oxygen free radical bursts, tissue edema, and microthrombus formation cause ischemia-reperfusion injury, further exacerbating flap necrosis [10]. Around the third postoperative day, under the regulation of hypoxia-inducible factor-1α (HIF-1α), endothelial cells of the original blood vessels in the flap are activated by growth factors including vascular endothelial growth factor (VEGF) and platelet-derived growth factor (PDGF). These cells proliferate and migrate to form new capillary buds, interconnecting to create a functional microvascular network that generates fresh blood supply to promote flap healing [10,11].
Platelet-rich plasma (PRP), a platelet-concentrated biological agent isolated through gradient centrifugation from autologous whole blood, contains platelets 3-5 times more abundant than peripheral blood. Platelet-rich gel (PRG), a gelatinous substance produced by adding activators to PRP, shares the ability to enhance growth factor concentrations and reduce inflammatory cytokine responses [12,13]. However, due to the weight limitations of rats, autologous blood supply could not be achieved. This study therefore used allogeneic rat blood for PRP and PRG preparation. No significant immune rejection was observed during the experiment, consistent with Akbarzadeh S et al.'s findings [14]. Beyond its high platelet concentration, PRP contains multiple key growth factors, particularly platelet-derived growth factor (PDGF) and vascular endothelial growth factor (VEGF). ELISA confirmed that these factors in PRP are 3-4 times higher than in ordinary plasma while maintaining high activity.
VEGF, a 45-kD heparin-binding dimeric glycoprotein, is recognized as the most potent regulator in angiogenesis induction [15]. By binding to its receptor VEGFR2, VEGF activates the P13K/AKT signaling pathway, which phosphorylates and activates endothelial nitric oxide synthase (eNOS) in endothelial cells. This increases NO production, thereby inducing vasodilation, promoting angiogenesis, and improving vascular permeability [16]. Kryger Z, Vourtsis SA et al. created rat skin flaps and administered VEGF suspension to the distal 1/3 flap through various delivery methods [17,18]. They found that under conditions of hypoxia and endothelial cell damage, regardless of delivery method, VEGF could enhance blood flow and flap survival in rat skin flaps. In our study, point injections of PRP or PRG were administered at the flap margins, with photographic documentation followed by Image Pro Plus analysis of necrotic areas. The analysis of the data revealed that the saline group showed significantly increased necrotic area by day 7 compared to day 3. In contrast, the PRP or PRG groups demonstrated no significant difference in necrotic extent between days 3 and 7. These findings suggest that while PRP supplementation cannot reverse necrotic outcomes, it effectively delays the progression of necrosis. Immunohistochemical analysis further demonstrated markedly higher growth factor levels in PRP/PRG groups compared to saline control, with PRG supplementation showing more substantial improvements. The results indicate that PRP/PRG supplementation enhances tissue growth factor concentrations, activates vascular endothelial cells to promote angiogenesis, and delays necrotic progression, thereby improving necrosis rates. However, these effects were limited in flaps already showing significant necrosis.
Ischemic necrosis of rat skin flaps typically manifests as characteristic blackening, crusting, hardened texture, and absence of blood flow upon needle puncture at the distal flap. While these macroscopic signs may initially suggest vascular impairment, they fail to accurately reflect the pathological and physiological state of subcutaneous tissues. Epidermal appearance often fails to correlate with the extent of subcutaneous edema or the defect range in microcirculatory perfusion imaging. Contrast-enhanced ultrasonography (CEUS) utilizes contrast agents such as sulfur hexafluoride microbubbles, with their diameter strictly controlled within 2-5μm. These microbubbles are completely metabolized through respiratory pathways within 15 minutes, eliminating dependence on hepatic and renal metabolic systems. Data from a large-scale multicenter clinical study involving 460,000 patients demonstrated an adverse event rate of merely 0.034%, with severe allergic reactions occurring at an even lower rate of 0.001%, highlighting CEUS' advantages of high stability, excellent imaging quality, low diffusion, high biocompatibility, and safety [19-21]. In this study, CEUS revealed that compared to the group receiving only saline postoperatively, the group receiving PRP showed significantly smaller imaging defects and milder edema. Notably, the PG+G group demonstrated the best results, with both the length of imaging defects and flap edema being significantly lower than other treatment groups.
Conclusion
The findings demonstrate that postoperative application of platelet-rich plasma (PRP) or platelet-rich gel (PRG) significantly improves subcutaneous tissue defect coverage and reduces flap edema. By elevating growth factor concentrations (e.g.: VEGF), these treatments enhance vascular regeneration in recipient sites, thereby improving flap survival rates and delaying necrosis. Notably, PRG exhibits superior efficacy. This study provides novel therapeutic strategies for reducing postoperative necrosis and accelerating wound healing in clinical flap transplantation.
Abbreviations
CD34, Colony Differentiation Antigen 34; CEUS, Contrast-Enhanced Ultrasound; HIF-1α, Hypoxia-Inducible Factor-1α; NO, Nitric Oxide; PDGF, Platelet-Derived Growth Factor; PRG, Platelet-Rich Plasma Gel; PRP, Platelet-Rich Plasma; VEGF, Vascular Endothelial Growth Factor; VEGFR2, Vascular Endothelial Growth Factor Receptor 2.
Supplementary Materials
Declarations
Author Contributions
Linsen Fang: Conceptualization, Methodology, Resources, Supervision, Project administration, Funding acquisition. Chengyang Dong: Conceptualization, Methodology, Software, Validation, Formal analysis, Investigation, Data curation, Writing - Original Draft, Writing - Review & Editing, Visualization. Zean Lin: Investigation, Writing - Original Draft. All authors read and approved the final manuscript.
Acknowledgements
Not Applicable.
Funding Information
Clinical Medicine Peak Discipline Construction Project of Anhui Medical University (Grant No. 9301001815).
Ethics Approval and Consent to Participate
Not Applicable.
Competing Interests
The authors declare that they have no existing or potential commercial or financial relationships that could create a conflict of interest at the time of conducting this study.
Data Availability
All data needed to evaluate the conclusions in the paper are present in the paper or the Supplementary Materials. Additional data related to this paper may be requested from the authors.
References
 Figures
 References
 Peer
Peer Information
Figure 1. Comparison of flap edema degree and defect length on POD 7. Comparison of flap edema severity and defect length on postoperative day 7 in six groups of rats. Thirty-six rats were randomly divided into a saline group (n=18, treated with normal saline) and an experimental group (n=18, treated with PRP+PRG). On postoperative day 3, the rats were further subdivided into three groups: an additional saline group (n=6), an additional PRP group (n=6), and an additional PRG group (n=6). On postoperative day 7, flap edema severity and defect length were measured using contrast-enhanced ultrasound. Data were presented as mean ± standard deviation (SD). Statistical analysis was performed using One-way ANOVA. PRP: Platelet-rich plasma; PRG: Platelet-rich gel. *P<0.05 when comparing the additional PRP group; **P<0.01; ***P<0.001; #P<0.05 when comparing with the additional PRG group; #P<0.01; #P<0.001; +P<0.05 when comparing with the group receiving PRP combined with PRG during surgery, ++P<0.01; +++P<0.001. X-axis: Group N+N; Group N+P; Group N+G; Group PG+N; Group PG+P; Group PG+G. Y-axis: edema thickness of skin flap (cm); length of contrast defect (cm).
Figure 2. HE staining of rat skin flaps. HE staining was performed to observe the integrity of tissue sections, the extent of inflammatory cell infiltration, and the number of blood vessels. HE staining revealed randomly selected sections. In group N+N, extensive inflammatory cell infiltration, vascular congestion, and tissue necrosis were observed. Group N+P with added PRP and Group N+G with added PRG showed better preservation of cell morphology and an increased number of blood vessels. Compared to group PG+N and group PG+P, group PG+G exhibited better tissue morphology, milder inflammatory infiltration, and a higher number of blood vessels. Yellow arrows indicate blood vessels; Green arrows indicate inflammatory cell infiltration. Scale = 100 μm. HE staining: Hematoxylin-eosin staining.
Figure 3. Immunohistochemical staining of VEGF in rat skin flaps. The relative expression levels of VEGF in tissues were detected by immunohistochemical staining. Five randomly selected sections with satisfactory staining were scored, and the final score was calculated as the average of the five scores. Positive results were defined as brown-yellow or brown-brown staining granules localized on the cytoplasm or cell membrane. The group receiving additional PRP or PRG showed a higher proportion of brownish-yellow areas and a higher final score. Scale = 20 μm. VEGF: vascular endothelial growth factor.
Figure 4. Immunohistochemical staining of PDGF in rat skin flaps. The relative expression levels of PDGF in tissues were detected by immunohistochemical staining. Five randomly selected sections with satisfactory staining were scored, and the final score was calculated as the average of the five scores. Positive results were defined as brown-yellow or brown-brown staining granules localized on the cytoplasm or cell membrane. The group receiving additional PRP or PRG showed a higher proportion of brownish-yellow areas and a higher final score. Scale = 20 μm. PDGF: platelet-derived growth factor.
Figure 5. Relative expression levels of VEGF and PDGF. The relative expression levels of VEGF and PDGF in tissues were detected by immunohistochemical staining. Five randomly selected sections with satisfactory staining were scored, and the final score was calculated as the average of the five scores. Positive results were defined as brown-yellow or brown-brown staining granules localized on the cytoplasm or cell membrane. Data were presented as mean ± standard deviation (SD). Statistical analysis was performed using One-way ANOVA. VEGF: vascular endothelial growth factor; PDGF: platelet-derived growth factor. *P<0.05 when comparing the additional PRP group; **P<0.01; ***P<0.001; #P<0.05 when comparing with the additional PRG group; #P<0.01; #P<0.001; +P<0.05 when comparing with the group receiving PRP combined with PRG during surgery, ++P<0.01; +++P<0.001. X-axis: Group N+N; Group N+P; Group N+G; Group PG+N; Group PG+P; Group PG+G. Y-axis: relative quantity.
Figure 6. CD34 staining results. Under the background of CD34 staining, 5 non-adjacent areas were randomly selected for scoring. The number of microvessels was counted and averaged to determine the vascular density of each sample. The stained sections revealed that the group supplemented with PRP and PRG exhibited a higher number of microvessels. CD34: colony differentiation antigen 34.
Figure 7. Microvessel Counting. Microvessel density (MVD) was expressed as the number of CD34-positive vessels per high-power field under light microscopy, with 5 randomly selected fields counted per slide. Data were presented as mean ± standard deviation (SD). Statistical analysis was performed using One-way ANOVA. *P<0.05 when comparing the additional PRP group; **P<0.01; ***P<0.001; #P<0.05 when comparing with the additional PRG group; #P<0.01; #P<0.001; +P<0.05 when comparing with the group receiving PRP combined with PRG during surgery, ++P<0.01; +++P<0.001. CD34: colony differentiation antigen 34; MVD: Microvessel density. X-axis: Group N+N; Group N+P; Group N+G; Group PG+N; Group PG+P; Group PG+G. Y-axis: relative quantity.
Peer-review Terminology
Identity transparency: Single anonymized
Reviewer interacts with: Editor
Details
This is an open access article under the terms of the Creative Commons Attribution License(http://creativecommons.org/licenses/by/4.0/), which permits use, distribution and reproduction in any medium, provided the original work is properly cited.
Publication History
Received 2025-12-17
Accepted 2026-04-14
Published 2026-05-16