




Abstract
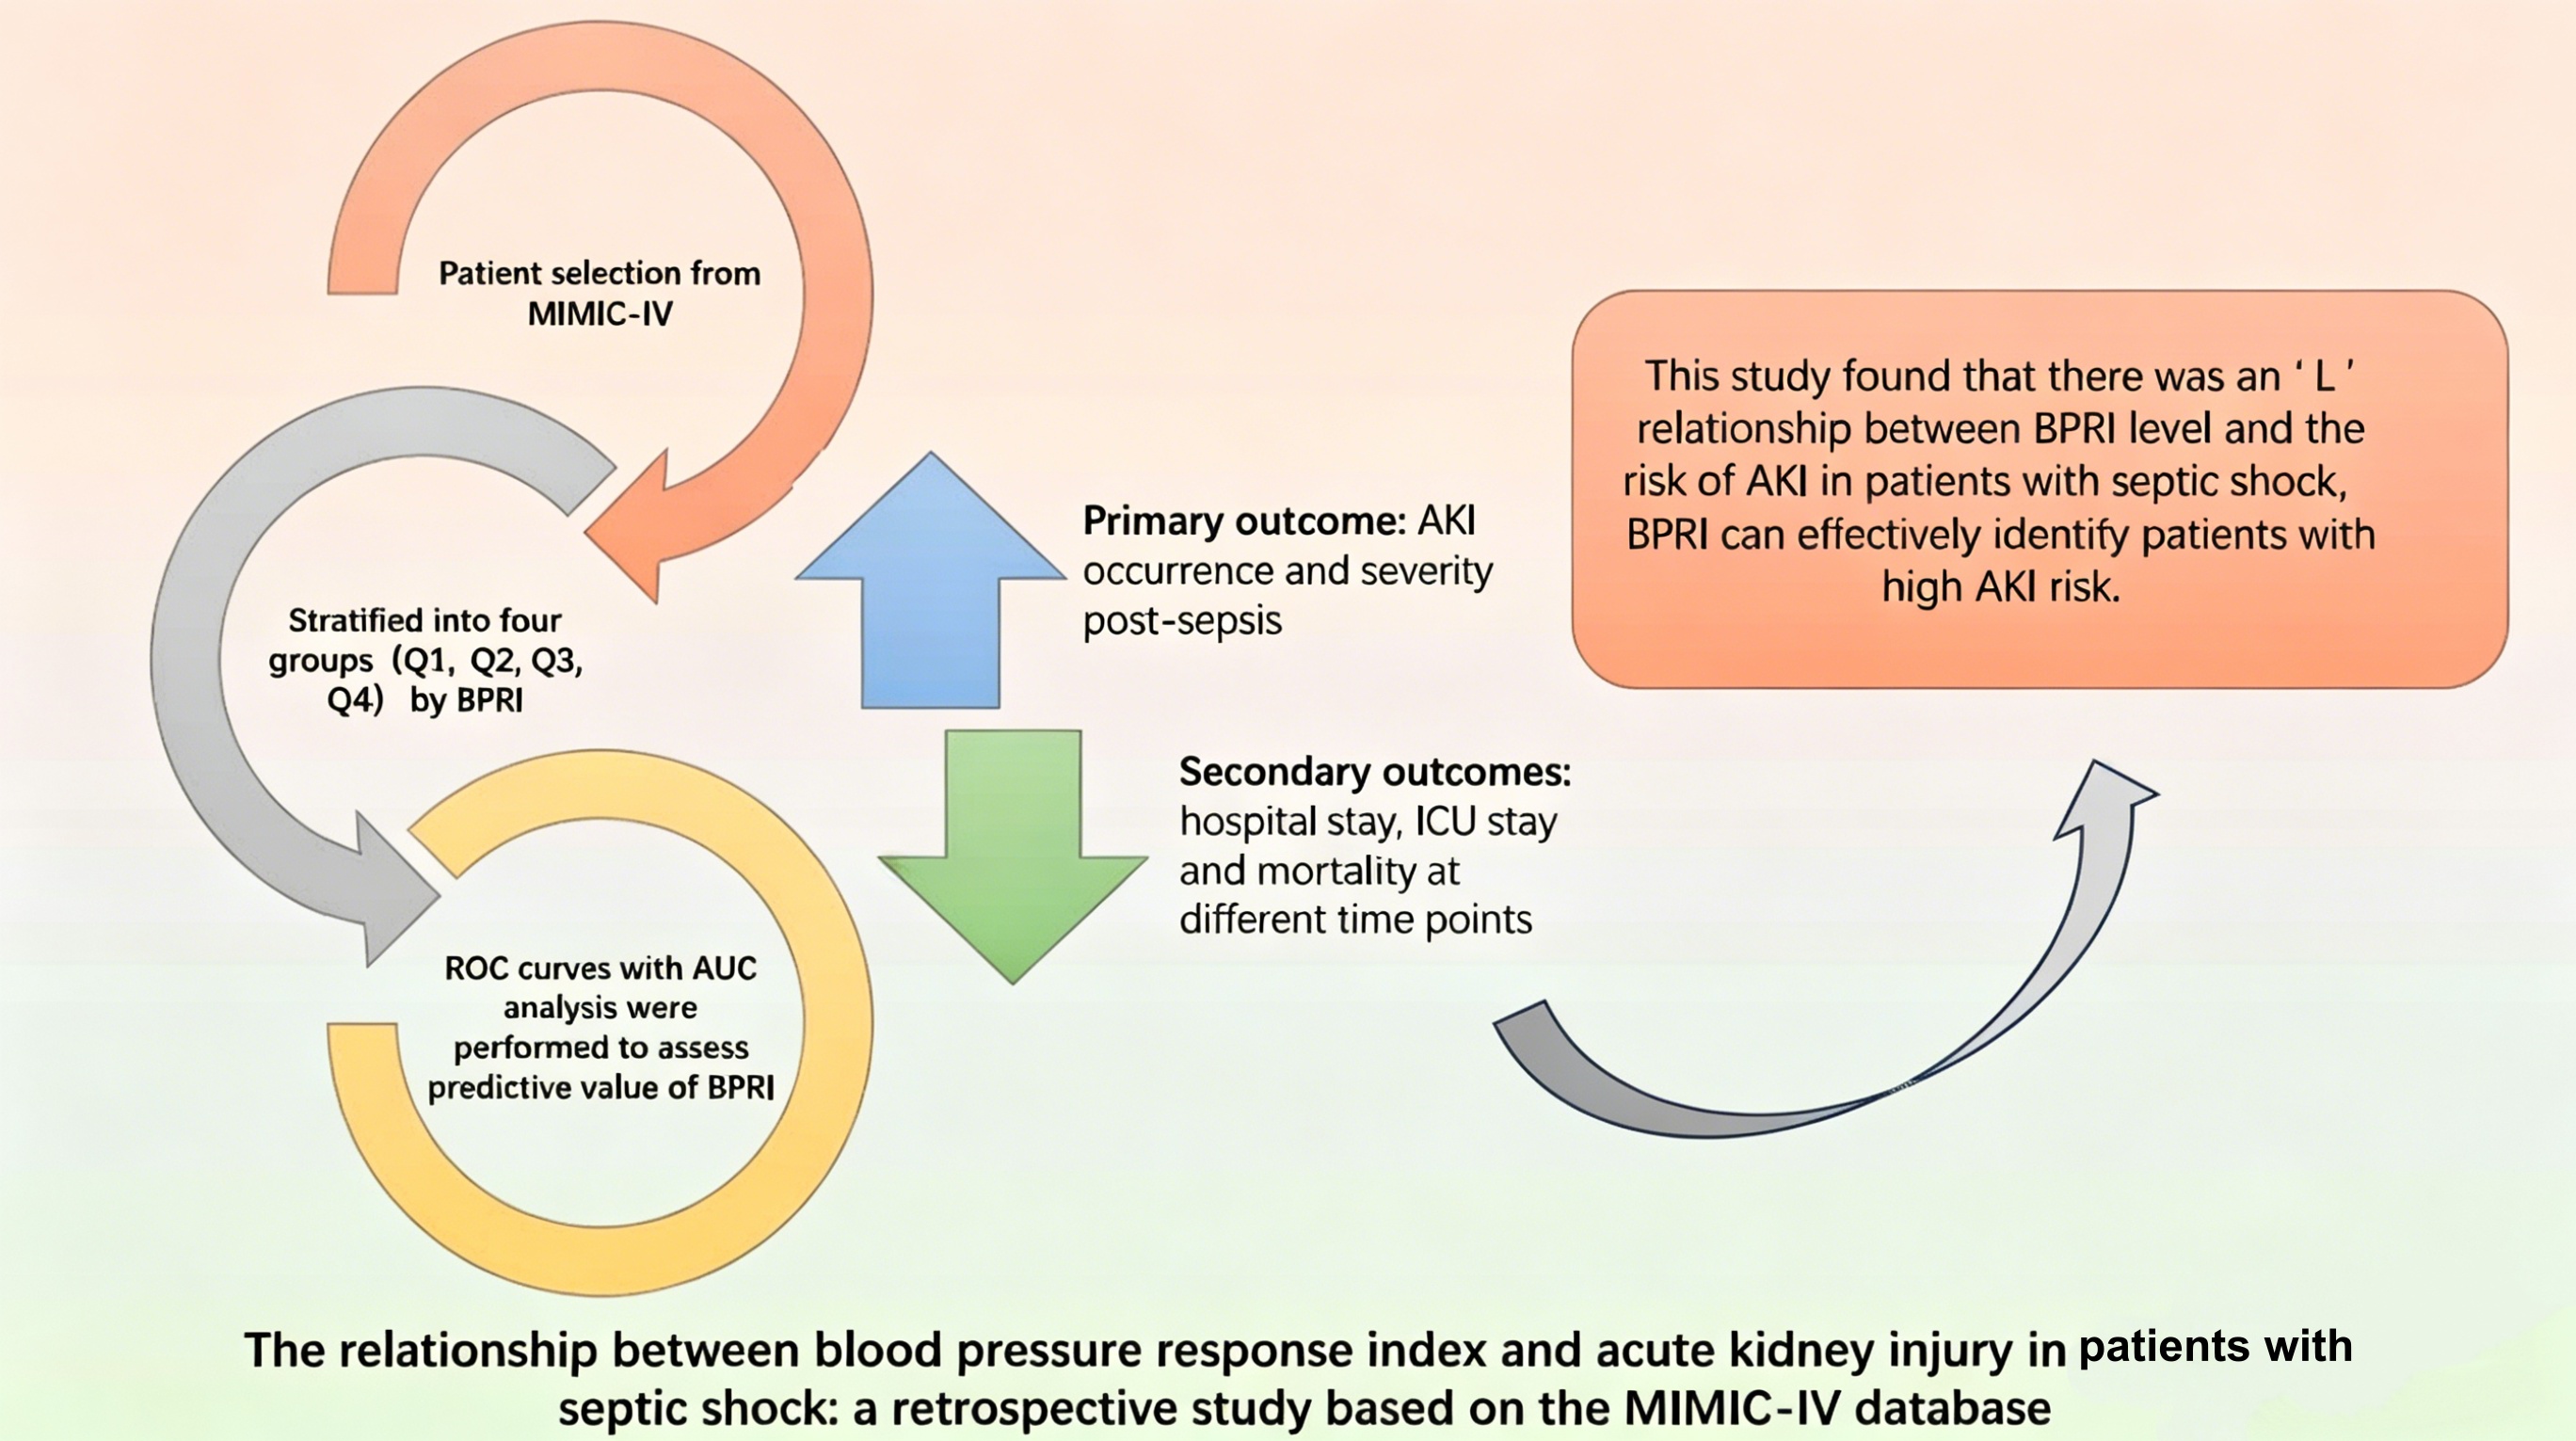
Background: The blood pressure response index (BPRI) is the ratio of mean arterial pressure (MAP) to the vasoactive-inotropic score (VIS). It accurately reflects the response to vasoactive drugs in patients with septic shock and assesses the patient's vascular status. However, the relationship between BPRI and the occurrence of acute kidney injury (AKI) in patients with septic shock has never been studied.
Methods: This study retrospectively analyzed patients diagnosed with sepsis and using vasoactive drugs in the MIMIC-IV database. The patients were divided into four groups according to the BPRI level. The primary outcome is whether AKI occurs after the diagnosis of sepsis. The association between BPRI and outcome was assessed by constructing logistic regression models and plotting restricted cubic spline (RCS) curves. The predictive value of the BPRI for outcome was evaluated by plotting receiver operating characteristic (ROC) curves and comparing areas under the curves (AUC).
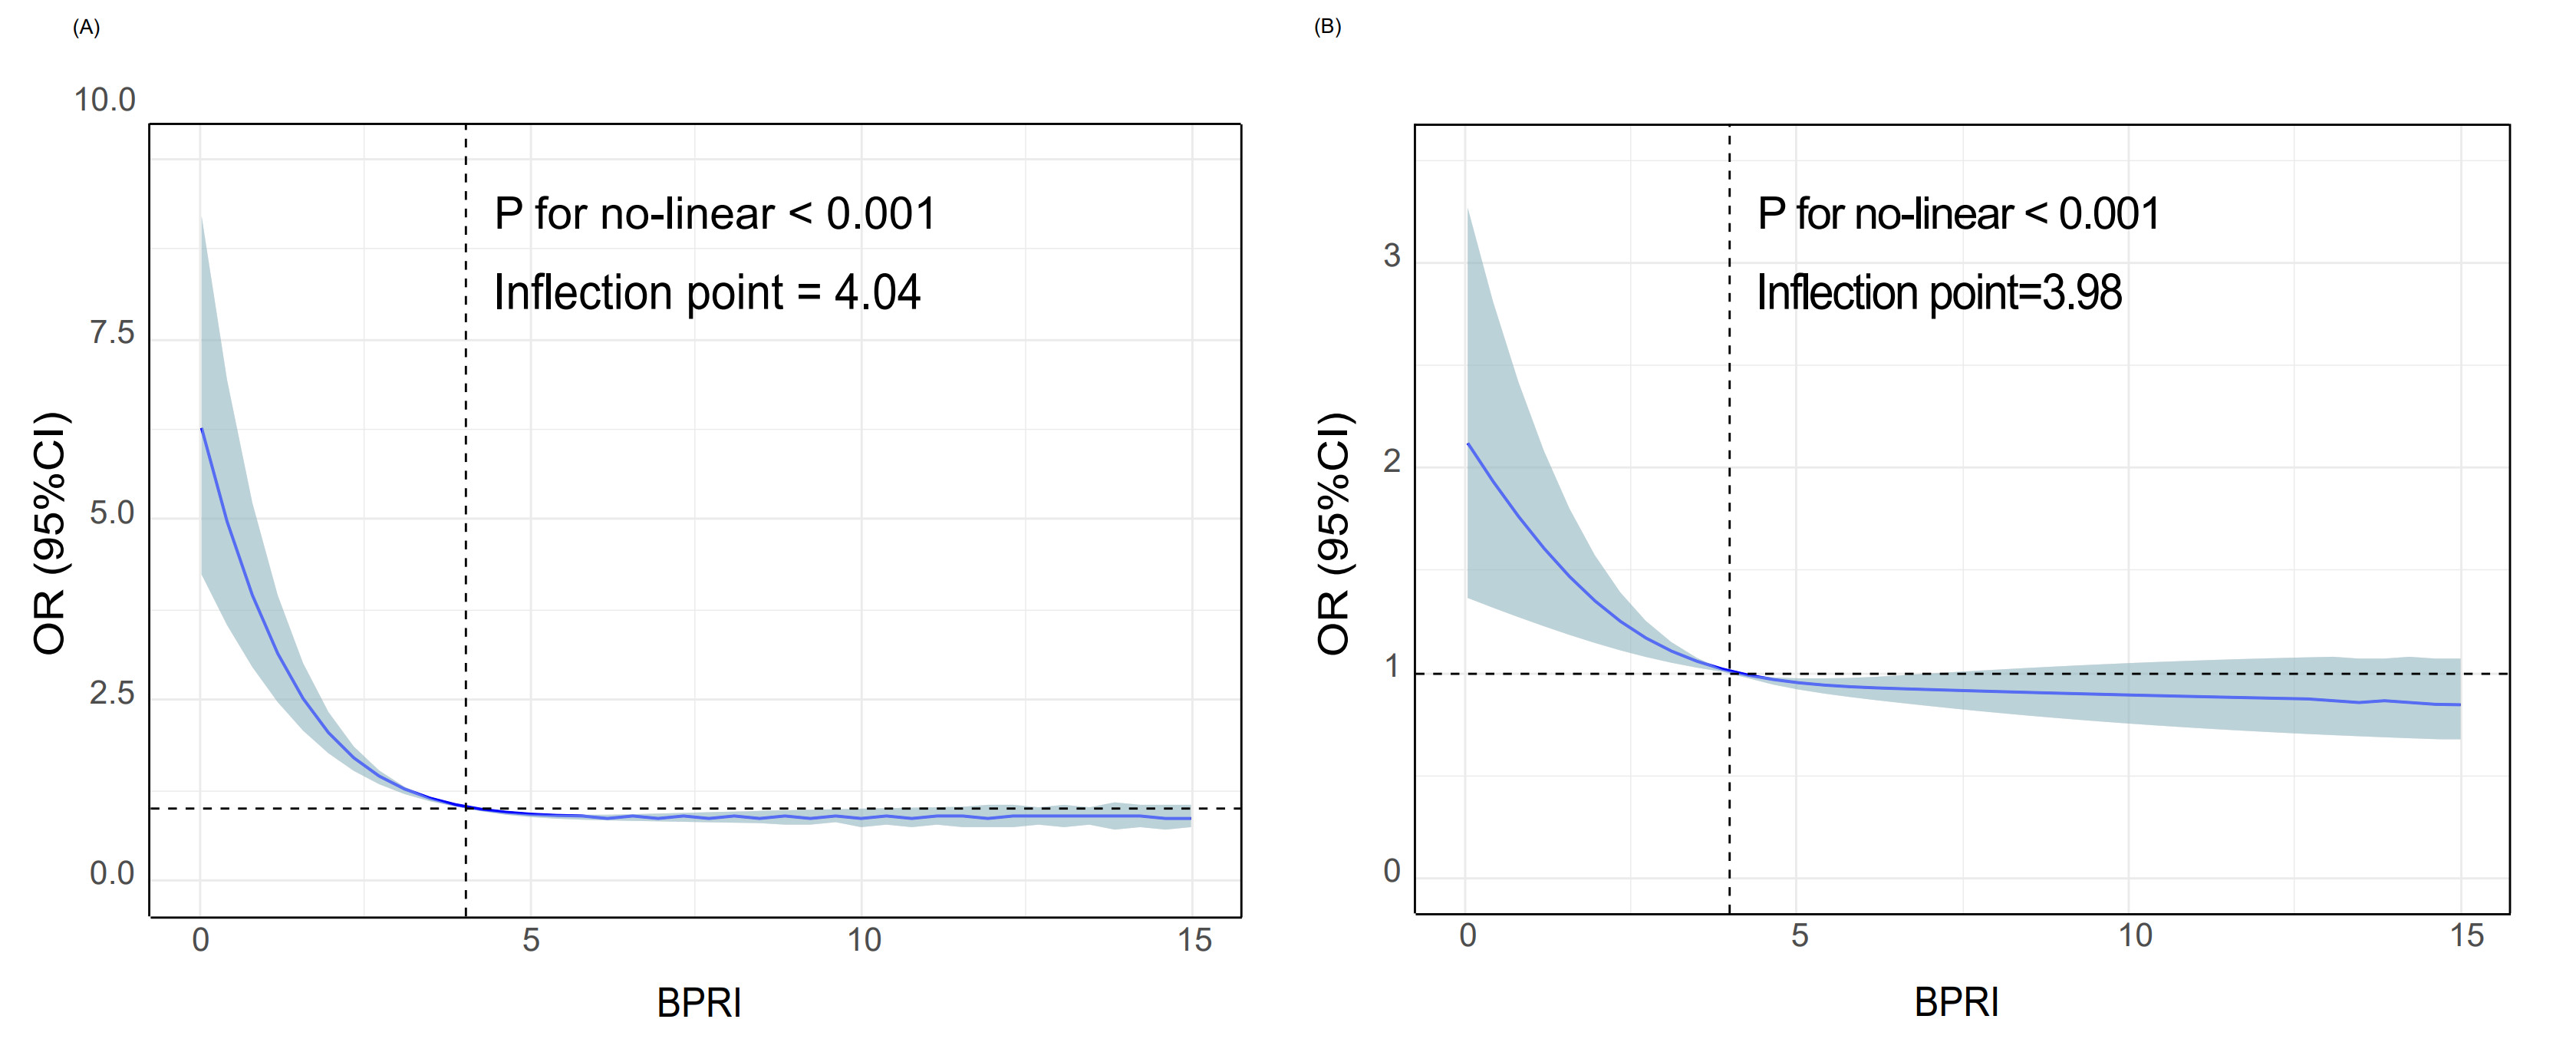
Results: 5524 patients with septic shock were finally included. The median age of the patients was 68.8 years, and 84.3% developed AKI after the diagnosis of sepsis. In a fully adjusted model, BPRI and the development of AKI were significantly correlated (OR [95%CI], 0.988 [0.979, 0.996], P = 0.006). The results of the RCS curves suggested an "L"-shaped association and the inflection point was located at the level of 3.98. On the left side of the inflection point, there was a decreasing trend in the risk of AKI in patients as BPRI levels increased (OR [95%CI], 0.82 [0.747, 0.9], P < 0.001). On the right side of the inflection point, there was no statistically significant association (OR [95%CI], 0.995 [0.985, 1.01], P = 0.212). In addition, the BPRI showed favorable predictive value for outcome (AUC [95% CI], 0.624 [0.601, 0.639]).
Conclusion: This study found that there was an 'L' relationship between BPRI level and the risk of AKI in patients with septic shock. When BPRI < 3.98, the risk of developing AKI increases dramatically with decreasing BPRI. As a simple and practical assessment index, BPRI can effectively identify patients with high AKI risk.
Keywords: septic shock; acute kidney injury; blood pressure response index; intensive care unit; MIMIC-IV database
Introduction
Sepsis is a life-threatening organ dysfunction caused by dysregulation of the body's response to infection and is one of the leading causes of death in intensive care unit (ICU) patients [1]. The incidence of acute kidney injury (AKI) in patients with sepsis is up to 70% or more, with prolonged hospitalization cycles and approximately one-fold higher morbidity and mortality rates in patients with concurrent AKI compared to sepsis patients without concurrent AKI [2, 3]. In patients with septic shock, persistent renal insufficiency of perfusion is a major cause of AKI [4]. The Surviving Sepsis Campaign guidelines recommend controlling patients' mean arterial pressure (MAP) above 65 mmHg [5].
However, in distributed shock due to infection, although sufficient cardiac output and large circulation pressure can be maintained, persistent organ hypoperfusion may still occur due to the loss of automatic regulation of vasoconstriction and decreased arterial tension [6, 7]. Moreover, due to the widespread use of vasoactive drugs, MAP-based monitoring may not reflect the actual organ perfusion of the patient [8, 9]. The blood pressure response index (BPRI) is the ratio between MAP and the vasoactive-inotropic score (VIS) [10, 11]. Recently, it has been found that the BPRI accurately responds to vasoactive medications in patients with septic shock, allowing for a convenient assessment of the patient's vascular status [11]. In multicenter cohort studies, BPRI has been shown to be strongly associated with poor patient prognosis [11]. However, the relationship between BPRI and the development of AKI in patients with septic shock is unclear.
In this study, we hypothesize that BPRI and the occurrence of AKI in septic shock patients are closely related and can be used as an accurate predictor. We will test this hypothesis by retrospectively analyzing a large sample of septic shock patients in the Medical Information Mart for Intensive Care-IV database.
Materials and Methods
Data sources
All data for this study were obtained from the Beth Israel Deaconess Medical Center (BIDMC) intensive care unit database (MIMIC-IV 2.2) [12]. The database covers the period from 2008 to 2019 and includes detailed medical information on nearly 200,000 hospitalizations as well as over 50,000 patients admitted to the ICU. In addition, MIMIC-IV data are rigorously de-identified to ensure that patient privacy is effectively protected. It is worth mentioning that all patients included in this database were adults (age > 18 years). The institutional review board of BIDMC waived the declaration of ethical review and informed consent and approved the sharing of research resources. One of the authors has applied for access to this database (Certificate number: 58951192).
Study objects
All patients were admitted to the ICU for the first time and stayed for more than 24 hours. These patients were diagnosed with sepsis on the first day of ICU admission and were treated with vasoactive drugs. Sepsis was defined using the Third International Consensus on Sepsis and Septic Shock (Sepsis-3) as an increase of at least 2 points in the sequential organ failure assessment (SOFA) score from baseline on the basis of infection or suspected infection [13].
Formulas and outcomes
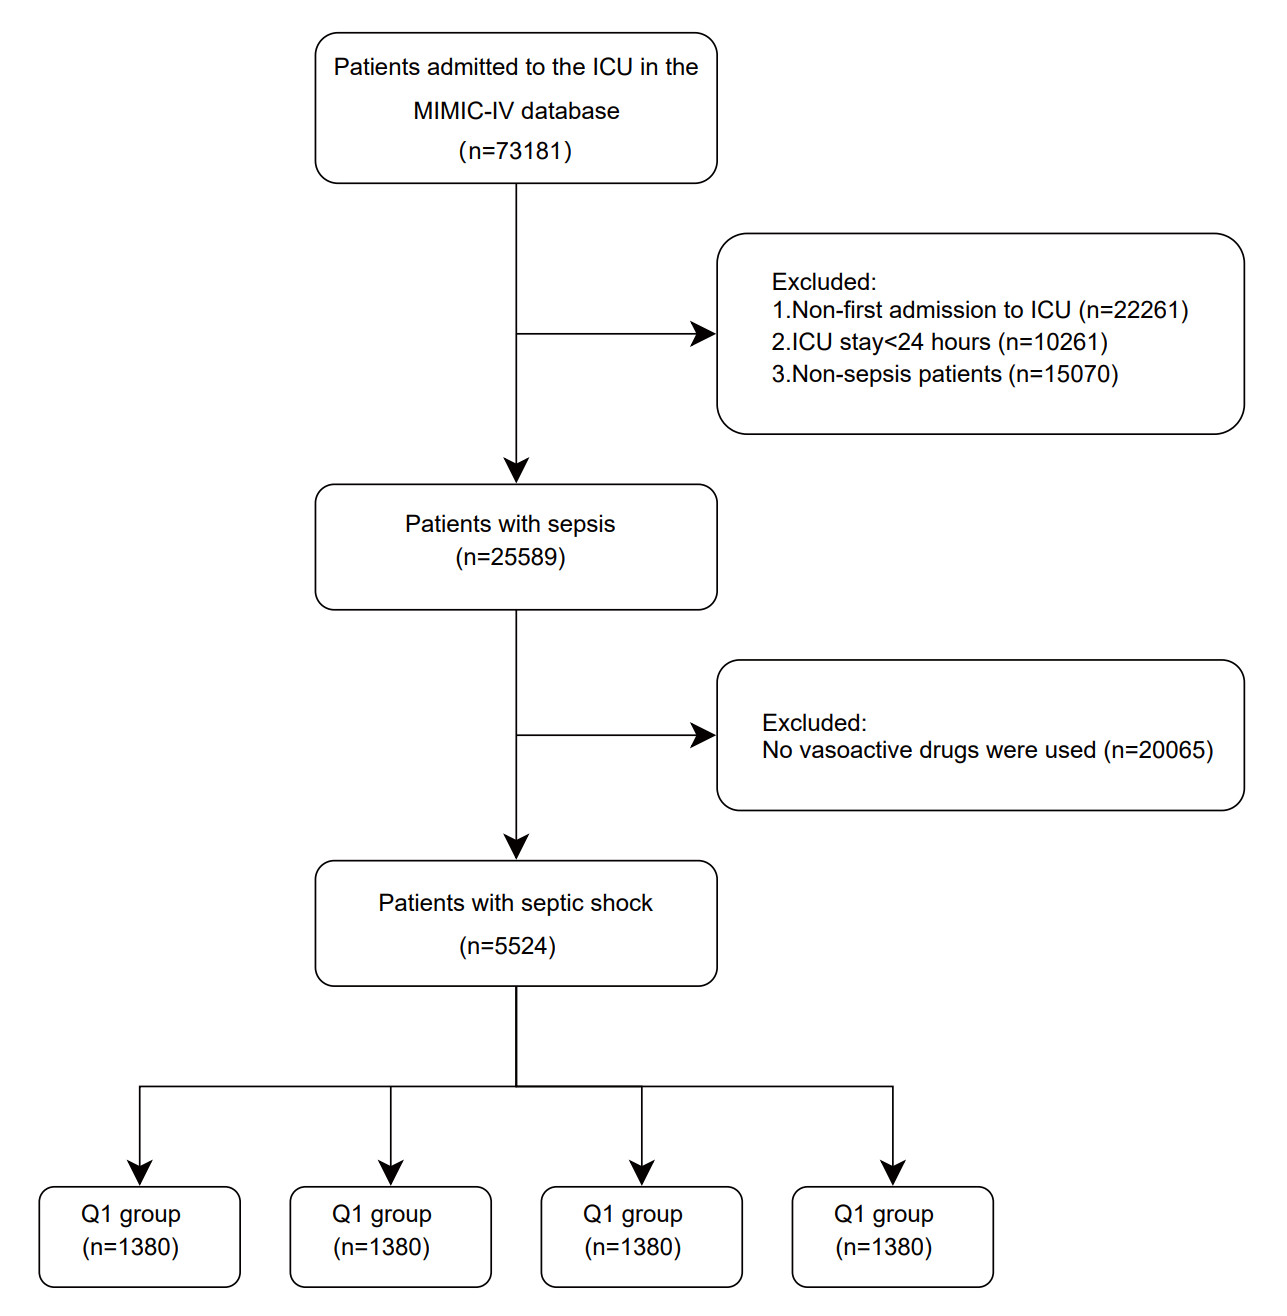
VIS formula: dopamine (μg/kg/min) + dobutamine (μg/kg/min) + epinephrine (μg/kg/min) × 100 + norepinephrine (μg/kg/min) × 100 + vasopressin (U/kg/min) × 10,000 + milrinone (μg/kg/min) × 10 [14]. We chose the MAP with maximal support of vasoactive drugs and calculated the BPRI based on the ratio of MAP to VIS. Patients were categorized into four groups based on quartiles of BPRI: Q1 group (BPRI < 1.90), Q2 group (BPRI: 1.90–4.03), Q3 group (BPRI: 4.02–8.84), and Q4 group (BPRI > 8.84). The primary outcome of the study was whether AKI occurred after the diagnosis of septic shock and during ICU hospitalization. Secondary outcomes included: AKI staging, renal replacement therapy, in-hospital all-cause mortality, 30-day, 180-day, and 365-day all-cause mortality. The diagnosis and staging of AKI were determined according to the guidelines of Kidney Disease: Improving Global Outcomes (KDIGO-2012) [15]. The study flow chart is shown in Figure 1.
Figure 1. Flow chart. The flow chart illustrates the patient selection process for the study. Patients with septic shock from the MIMIC-IV database were screened according to predefined inclusion and exclusion criteria, resulting in a final cohort of 5524 patients for analysis.
Data collection
The following information was collected from the database by Navicat Premium 16.0 software. 1) General information: age, gender, weight, race, smoking history, type of ICU admission. 2) Comorbidities: hypertension, diabetes mellitus (DM), coronary heart disease (CHD), heart failure (HF), chronic obstructive pulmonary disease (COPD), chronic liver disease (CLD), chronic kidney disease (CKD). 3) Disease severity scores: acute physiology score-Ⅲ (APS-Ⅲ), SOFA score, charles comorbidity index (CCI), glasgow coma scale (GCS) score. 4) Various inspections on the first day in the ICU: white blood cell (WBC) count, red blood cell (RBC) count, platelet (PLT) count, hemoglobin (Hb), serum creatinine (SCr), blood urea nitrogen (BUN), lactic acid, bicarbonate, pH, prothrombin time (PT), activated partial thromboplastin time (APTT), international normalized ratio (INR), sodium, potassium, chlorine, urine volume. 5) Treatments received on the first day of ICU admission: diuretics, sedative drugs, and invasive mechanical ventilation (IMV). All variables were missing within 15%.
Statistical analysis
Statistical analyses were done through R software (version 4.3.3). Categorical variables were expressed as frequencies (proportions) and continuous variables as medians (interquartile range). Categorical variables were compared by chi-square test. Continuous variables were skewed and compared by the Mann-Whitney U test.
The correlation between BPRI and the occurrence of AKI was assessed by univariate and multivariate logistic regression models. We adjusted for potential confounders through three models based on factors from previous studies that may have influenced study variables or outcomes. Model 1 adjusted for general information (age, gender, weight, race, smoking history). Model 2 added comorbidities and various scores (hypertension, DM, CHD, HF, CKD, APS-III, SOFA score, and GCS score) to Model 1. Model 3 adds various tests and treatments (WBC count, PLT count, Hb, lactic acid, pH, PT, INR, potassium, diuretics, sedative drugs, IMV) to Model 2. Restricted cubic spline (RCS) curves were plotted within the framework of the unadjusted model and Model 3 to further assess associations between study variables and outcomes.
Analyze the predictive value of the BPRI for endpoints by plotting the receiver operating characteristic (ROC) curve and comparing the area under the curve (AUC). Incorporate study metrics into existing disease severity scores and compare whether the BPRI improves the accuracy of the scores in predicting study outcomes. Predictive performance was compared using the Delong test. In addition, to further assess differences in the impact of BPRI in different populations, we also performed subgroup analyses in adjusted model 3. Two-sided P values below 0.05 were considered statistically significant.
Results
Baseline data analysis
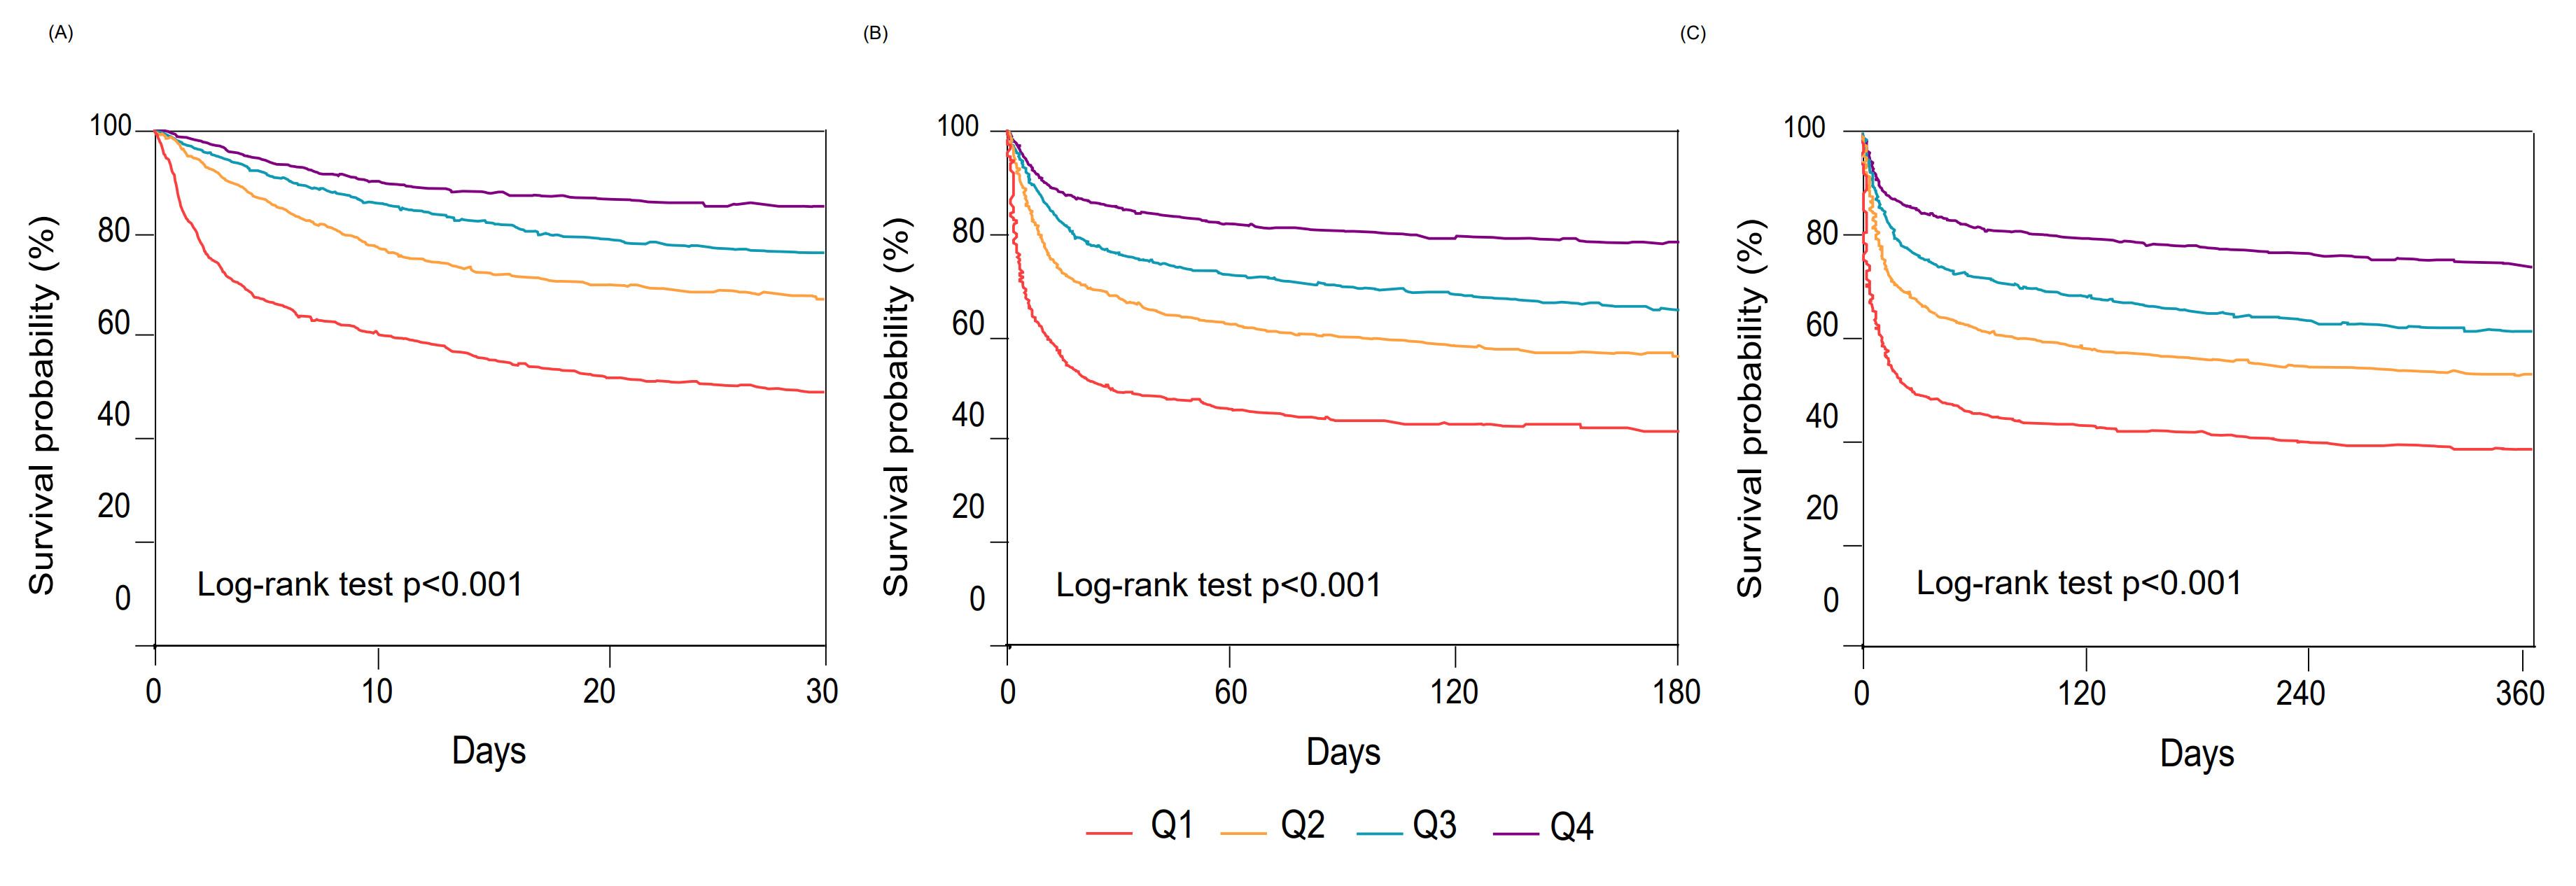
A final total of 5524 patients with septic shock were included. In the study cohort, the median age of the patients was 68.8 years, 57.6% were female, and 64.1% were white. Patients were divided into 4 groups based on BPRI levels, and the baseline information for each group is shown in Table 1. The patients were also grouped according to the occurrence of AKI, and the baseline information of the two groups is shown in Supplementary Table 1. The profile of study variables and outcomes for each group of patients is shown in Table 2. In the study cohort, norepinephrine was used most frequently (85.5%), followed by vasopressin (27.9%), and dobutamine (5.1%) least frequently. The incidence of AKI in the total population was 84.3%. The odds of developing AKI were significantly higher in all groups of patients as the level of BPRI decreased (P < 0.001). In addition, patients in the Q1 group had significantly higher final AKI stage, odds of receiving RRT, hospitalization period, and in-hospital all-cause mortality than patients in the other three groups (P < 0.001). Kaplan-Meyer survival analysis showed a stepwise distribution of 30-, 180-, and 365-day survival rates in each group of patients as BPRI levels decreased (Figure 2).
Table 1. Baseline characteristics of patients in each group.
| Variables | Total (n=5524) |
Q1 group (n=1380) |
Q2 group (n=1382) |
Q3 group (n=1381) |
Q4 group (n=1381) |
P-value |
|---|---|---|---|---|---|---|
| General information | ||||||
| Age, year | 68.8 (57.8, 79.3) | 67.5 (57.0, 78.7) | 69.6 (57.3, 80.2) | 69.7 (58.2, 79.4) | 68.4 (59.0, 78.7) | .021 |
| Gender, female | 3181 (57.6%) | 782 (56.7%) | 775 (56.1%) | 790 (57.2%) | 834 (60.4%) | .098 |
| Weight, kg | 79.1 (66.6, 95.0) | 77.2 (65.0, 93.4) | 78.2 (65.8, 94.0) | 79.0 (66.7, 93.1) | 81.2 (68.5, 98.9) | <.001 |
| Race | <.001 | |||||
| White | 3542 (64.1%) | 798 (57.8%) | 881 (63.7%) | 901 (65.2%) | 962 (69.7%) | |
| Black | 389 (7%) | 102 (7.4%) | 94 (6.8%) | 102 (7.4%) | 91 (6.6%) | |
| Other | 1593 (28.8%) | 480 (34.8%) | 407 (29.5%) | 378 (27.4%) | 328 (23.8%) | |
| Smoking history | 1567 (28.4%) | 353 (25.6%) | 400 (28.9%) | 428 (31%) | 386 (28%) | .016 |
| Type of ICU | <.001 | |||||
| MICU | 2668 (48.3%) | 730 (52.9%) | 717 (51.9%) | 708 (51.3%) | 513 (37.1%) | |
| SICU | 1041 (18.8%) | 332 (24.1%) | 292 (21.1%) | 258 (18.7%) | 159 (11.5%) | |
| Other | 1815 (32.9%) | 318 (23%) | 373 (27%) | 415 (30.1%) | 709 (51.3%) | |
| Complications | ||||||
| Hypertension | 3720 (67.3%) | 875 (63.4%) | 911 (65.9%) | 946 (68.5%) | 988 (71.5%) | <.001 |
| DM | 1705 (30.9%) | 400 (29%) | 394 (28.5%) | 452 (32.7%) | 459 (33.2%) | .008 |
| CHD | 1887 (34.2%) | 357 (25.9%) | 448 (32.4%) | 481 (34.8%) | 601 (43.5%) | <.001 |
| HF | 1512 (27.4%) | 340 (24.6%) | 381 (27.6%) | 394 (28.5%) | 397 (28.7%) | .059 |
| COPD | 407 (7.4%) | 102 (7.4%) | 104 (7.5%) | 115 (8.3%) | 86 (6.2%) | .208 |
| Stroke | 404 (7.3%) | 100 (7.2%) | 123 (8.9%) | 80 (5.8%) | 101 (7.3%) | .020 |
| CID | 611 (11.1%) | 202 (14.6%) | 162 (11.7%) | 155 (11.2%) | 92 (6.7%) | <.001 |
| CKD | 271 (4.9%) | 69 (5%) | 82 (5.9%) | 62 (4.5%) | 58 (4.2%) | .162 |
| Various scores | ||||||
| APS-Ⅲ | 64.0 (45.0, 90.0) | 86.0 (65.0, 110.0) | 68.0 (49.0, 92.0) | 56.0 (42.0, 77.0) | 49.0 (35.0, 71.0) | <.001 |
| SOFA score | 10.0 (7.0, 12.0) | 12.0 (10.0, 15.0) | 10.0 (8.0, 13.0) | 9.0 (7.0, 11.0) | 7.0 (5.0, 10.0) | <.001 |
| CCI | 6.0 (4.0, 8.0) | 6.0 (4.0, 8.0) | 6.0 (4.0, 8.0) | 6.0 (4.0, 8.0) | 6.0 (4.0, 7.0) | <.001 |
| GCS score | 13.0 (8.0, 15.0) | 11.0 (6.0, 14.0) | 12.0 (7.0, 14.0) | 13.0 (9.0, 15.0) | 14.0 (10.0, 15.0) | <.001 |
| VIS | 18.1 (8.0, 38.4) | 55.8 (48.1, 80.0) | 25.4 (20.0, 30.1) | 12.0 (10.0, 15.0) | 5.0 (3.0, 6.0) | <.001 |
| BPRI | 4.0 (1.9, 8.8) | 1.3 (0.9, 1.6) | 2.8 (2.3, 3.4) | 6.1 (4.8, 7.3) | 15.3 (11.9, 24.3) | <.001 |
| Various inspections | ||||||
| WBC count, ×10⁹/L | 12.0 (8.7, 16.5) | 14.0 (9.7, 20.1) | 12.3 (9.0, 17.1) | 11.1 (8.0, 15.0) | 11.3 (8.4, 14.9) | <.001 |
| RBC count, ×10¹²/L | 3.2 (2.8, 3.6) | 3.2 (2.8, 3.6) | 3.2 (2.8, 3.6) | 3.2 (2.8, 3.6) | 3.3 (2.9, 3.7) | <.001 |
| PLT, ×10⁹/L | 144.0 (101.0, 204.0) | 127.0 (76.0, 190.0) | 147.0 (101.0, 211.0) | 153.0 (109.0, 213.0) | 145.0 (108.0, 199.0) | <.001 |
| Hb, mg/dl | 9.6 (8.5, 10.8) | 9.6 (8.4, 10.8) | 9.6 (8.4, 10.8) | 9.6 (8.5, 10.8) | 9.8 (8.7, 10.9) | .005 |
| SCr, mg/dl | 1.2 (0.8, 2.1) | 1.7 (1.0, 2.8) | 1.2 (0.8, 2.1) | 1.1 (0.8, 1.9) | 1.1 (0.8, 1.5) | <.001 |
| BUN, mg/dl | 25.0 (15.0, 41.0) | 31.0 (20.0, 47.0) | 27.0 (16.0, 41.0) | 23.0 (14.0, 39.0) | 21.0 (14.0, 32.0) | <.001 |
| Lactic acid, mmol/L | 1.6 (1.2, 2.1) | 1.9 (1.4, 2.6) | 1.5 (1.2, 2.0) | 1.4 (1.1, 1.8) | 1.5 (1.1, 2.0) | <.001 |
| Bicarbonate, mEq/L | 1.5 (1.2, 2.0) | 1.7 (1.3, 2.4) | 1.5 (1.2, 2.0) | 1.4 (1.1, 1.8) | 1.5 (1.1, 2.0) | <.001 |
| pH, units | 7.4 (7.3, 7.4) | 7.4 (7.3, 7.4) | 7.4 (7.3, 7.4) | 7.4 (7.3, 7.4) | 7.4 (7.3, 7.4) | <.001 |
| PT, s | 14.8 (13.2, 18.0) | 16.6 (13.9, 21.9) | 14.9 (13.3, 18.1) | 14.4 (12.9, 16.8) | 14.1 (12.9, 15.9) | <.001 |
| APTT, s | 33.0 (28.8, 42.5) | 37.7 (30.7, 50.1) | 33.8 (29.2, 42.9) | 31.9 (28.2, 39.8) | 31.0 (27.8, 37.3) | <.001 |
| INR | 1.3 (1.2, 1.6) | 1.5 (1.3, 2.0) | 1.4 (1.2, 1.6) | 1.3 (1.2, 1.5) | 1.3 (1.2, 1.5) | <.001 |
| Sodium, mEq/L | 138.0 (135.0, 141.0) | 137.0 (134.0, 141.0) | 138.0 (135.0, 142.0) | 139.0 (136.0, 142.0) | 138.0 (135.0, 141.0) | <.001 |
| Potassium, mEq/L | 4.1 (3.8, 4.5) | 4.2 (3.8, 4.8) | 4.1 (3.7, 4.5) | 4.1 (3.7, 4.4) | 4.1 (3.8, 4.4) | <.001 |
| Chlorine, mEq/L | 104.0 (100.0, 108.0) | 104.0 (98.0, 108.0) | 105.0 (101.0, 109.0) | 105.0 (101.0, 109.0) | 104.0 (100.0, 108.0) | <.001 |
| Urine volume, ml | 1335.5 (704.5, 2225.0) | 896.0 (365.5, 1765.0) | 1245.0 (655.0, 2140.0) | 1470.0 (860.0, 2325.0) | 1665.0 (1050.0, 2494.0) | <.001 |
| MAP, mmHg | 72.7 (68.5, 77.5) | 71.6 (66.9, 76.0) | 72.5 (68.5, 76.7) | 72.7 (68.7, 77.8) | 74.3 (70.1, 79.3) | <.001 |
| Received treatment | ||||||
| Diuretics | 1445 (26.2%) | 296 (21.4%) | 315 (22.8%) | 350 (25.3%) | 484 (35%) | <.001 |
| Sedative drugs | 4221 (76.4%) | 1221 (88.5%) | 1062 (76.8%) | 918 (66.5%) | 1020 (73.9%) | <.001 |
| IMV | 3938 (71.3%) | 1142 (82.8%) | 1002 (72.5%) | 837 (60.6%) | 957 (69.3%) | <.001 |
Note: ICU, intensive care unit; MICU, medical ICU; SICU, surgical ICU; DM, diabetes mellitus; CHD, coronary heart disease; HF, heart failure; COPD, chronic obstructive pulmonary disease; CID, chronic liver disease; CKD, chronic kidney disease; APS-Ⅲ, acute physiology score-Ⅲ; SOFA, sequential organ failure assessment; CCI, charles comorbidity index; GCS, glasgow coma scale; VIS, vasoactive-inotropic score; BPRI, blood pressure response index; WBC, white blood cell; RBC, red blood cell; PLT, platelet; Hb, hemoglobin; SCr, serum creatinine; BUN, blood urea nitrogen; PT, prothrombin time; APTT, activated partial thromboplastin time; INR, international normalized ratio; MAP, mean arterial pressure; IMV, invasive mechanical ventilation. Values are the median (interquartile range), or n (%).
Table 2. Hemodynamic drugs and study outcomes.
| Total (n=5524) |
Q1 (n=1380) |
Q2 (n=1382) |
Q3 (n=1381) |
Q4 (n=1381) |
P-value | |
|---|---|---|---|---|---|---|
| Hemodynamic drugs | ||||||
| Dopamine | 579 (10.5%) | 196 (14.2%) | 123 (8.9%) | 139 (10.1%) | 121 (8.8%) | <.001 |
| Dobutamine | 282 (5.1%) | 132 (9.6%) | 62 (4.5%) | 32 (2.3%) | 56 (4.1%) | <.001 |
| Epinephrine | 1021 (18.5%) | 331 (24%) | 171 (12.4%) | 126 (9.1%) | 393 (28.5%) | <.001 |
| Norepinephrine | 4722 (85.5%) | 1373 (99.5%) | 1341 (97%) | 1251 (90.6%) | 757 (54.8%) | <.001 |
| Vasopressin | 1542 (27.9%) | 887 (64.3%) | 419 (30.3%) | 133 (9.6%) | 103 (7.5%) | <.001 |
| Milrinone | 302 (5.5%) | 58 (4.2%) | 84 (6.1%) | 68 (4.9%) | 92 (6.7%) | <.001 |
| Outcomes | ||||||
| AKI | 4658 (84.3%) | 1287 (93.3%) | 1186 (85.8%) | 1089 (78.9%) | 1096 (79.4%) | <.001 |
| AKI-stages | <.001 | |||||
| 0 | 866 (15.7%) | 93 (6.7%) | 196 (14.2%) | 292 (21.1%) | 285 (20.6%) | |
| 1 | 700 (12.7%) | 132 (9.6%) | 161 (11.6%) | 184 (13.3%) | 223 (16.1%) | |
| 2 | 1845 (33.4%) | 378 (27.4%) | 456 (33%) | 452 (32.7%) | 559 (40.5%) | |
| 3 | 2113 (38.3%) | 777 (56.3%) | 569 (41.2%) | 453 (32.8%) | 314 (22.7%) | |
| RRT | 610 (11%) | 304 (22%) | 162 (11.7%) | 83 (6%) | 61 (4.4%) | <.001 |
| Hospitalization time, day | 9.7 (5.5, 16.8) | 10.2 (3.5, 19.5) | 10.8 (6.3, 18.1) | 9.6 (5.9, 16.2) | 8.6 (5.6, 13.7) | <.001 |
| Length of stay in ICU, day | 4.1 (2.3, 8.1) | 5.0 (2.6, 11.0) | 5.0 (2.9, 9.1) | 3.8 (2.3, 7.1) | 3.1 (1.9, 5.9) | <.001 |
| In-hospital mortality | 1536 (27.8%) | 676 (49%) | 406 (29.4%) | 275 (19.9%) | 179 (13%) | <.001 |
| 30 days mortality | 1688 (30.6%) | 702 (50.9%) | 450 (32.6%) | 329 (23.8%) | 207 (15%) | <.001 |
| 180 days mortality | 2191 (39.7%) | 802 (58.1%) | 605 (43.8%) | 479 (34.7%) | 305 (22.1%) | <.001 |
| 365 days mortality | 2391 (43.3%) | 851 (61.7%) | 653 (47.3%) | 535 (38.7%) | 352 (25.5%) | <.001 |
Note: AKI, acute kidney injury; RRT, renal replacement therapy; ICU, intensive care unit. Values are the median (interquartile range), or n (%).
Figure 2. Kaplan-Meyer survival analysis at 30 (A), 180 (B), and 365 days (C) for four groups of patients. Survival curves are stratified by BPRI quartile groups (Q1–Q4). A stepwise distribution of survival rates was observed across groups, with the Q1 group (lowest BPRI) showing the lowest survival rates at all time points. BPRI, blood pressure response index.
Correlation analysis
Through constructing a multifactorial logistic regression model, we found that BPRI and the incidence of AKI in septic shock patients during ICU hospitalization were strongly associated. The results were still significant in the unadjusted model (OR [95%CI], 0.982 [0.975, 0.988], P < 0.001) and the fully adjusted model (OR [95%CI], 0.988 [0.979, 0.996], P = 0.006). The Q4 group with the lowest incidence of AKI was set as the reference group. The risk of AKI in most groups of patients in each model was significantly higher than that in the Q4 group (Table 3). In both the unadjusted and fully adjusted models, the plotted RCS curves suggested an "L" shaped relationship between the level of BPRI and the risk of occurrence of AKI (Both P for no-linear < 0.001, Figure 3). Threshold effects analysis suggests that in the adjusted model, the inflection point of the BPRI is located at the 3.98 level. On the left side of the inflection point, there was a decreasing trend in the risk of AKI in patients as BPRI levels increased (OR [95%CI], 0.82 [0.747, 0.9], P < 0.001). On the right side of the inflection point, there was no statistically significant change in the risk of AKI in patients as BPRI levels increased (OR [95%CI], 0.995 [0.985, 1.01], P = 0.212) (Supplementary Table 2).
To evaluate the potential influence of phenylephrine, we also recalculated the BPRI by incorporating this agent into the VIS formula. The modified index retained a strong independent association with AKI in multivariable models. The RCS analysis (Supplementary Figure 1) reproduced the 'L-shaped' association seen in the primary cohort, identifying a nearly identical inflection point at 4.03. This consistency supports the validity of BPRI as a marker for renal risk, independent of vasopressor choice.
Table 3. Multifactorial logistic regression modeling to evaluate the association between BPRI and the incidence of AKI.
| Variables | Unadjusted model | Model 1 | Model 2 | Model 3 |
|---|---|---|---|---|
| BPRI | 0.982 (0.975, 0.988) *** | 0.976 (0.969, 0.983) *** | 0.996 (0.989, 1.001) | 0.988 (0.979, 0.996) ** |
| Q1 | 3.599 (2.820, 4.630) *** | 4.493 (3.492, 5.830) *** | 2.218 (1.669, 2.968) *** | 1.957 (1.453, 2.651) *** |
| Q2 | 1.573 (1.290, 1.923) *** | 1.780 (1.449, 2.191) *** | 1.138 (0.905, 1.432) | 1.322 (1.036, 1.690) ** |
| Q3 | 0.970 (0.807, 1.165) | 1.050 (0.868, 1.270) | 0.843 (0.686, 1.036) | 1.113 (0.893, 1.388) |
| Q4 | Ref. | Ref. | Ref. | Ref. |
| P for trend | <0.001 | <0.001 | 0.004 | <0.001 |
Note: P-value: *P<0.05, **P<0.01, ***P<0.001.
Model 1: After adjusting for age, gender, weight, race, and smoking history;
Model 2: adjusted for model 1, additionally adjusted for hypertension, DM, CHD, HF, CKD, APS-III, SOFA score, and GCS score;
Model 3: adjusted for model 2, additionally adjusted for WBC count, PLT count, Hb, Lactic acid, pH, PT, INR, potassium, diuretics, sedative drugs, and IMV. The abbreviations are as same as Table 1.
Figure 3. Correlation between BPRI and AKI incidence odds ratio in unadjusted model (A) and adjusted model 3 (B). Restricted cubic spline (RCS) curves show an "L"-shaped association between BPRI levels and the risk of AKI occurrence. The inflection point is located at BPRI = 3.98. On the left side of the inflection point, AKI risk decreases significantly as BPRI increases. On the right side, no statistically significant association was observed. BPRI, blood pressure response index; AKI, acute kidney injury; OR, odds ratio; CI, confidence interval.
Predictive analysis
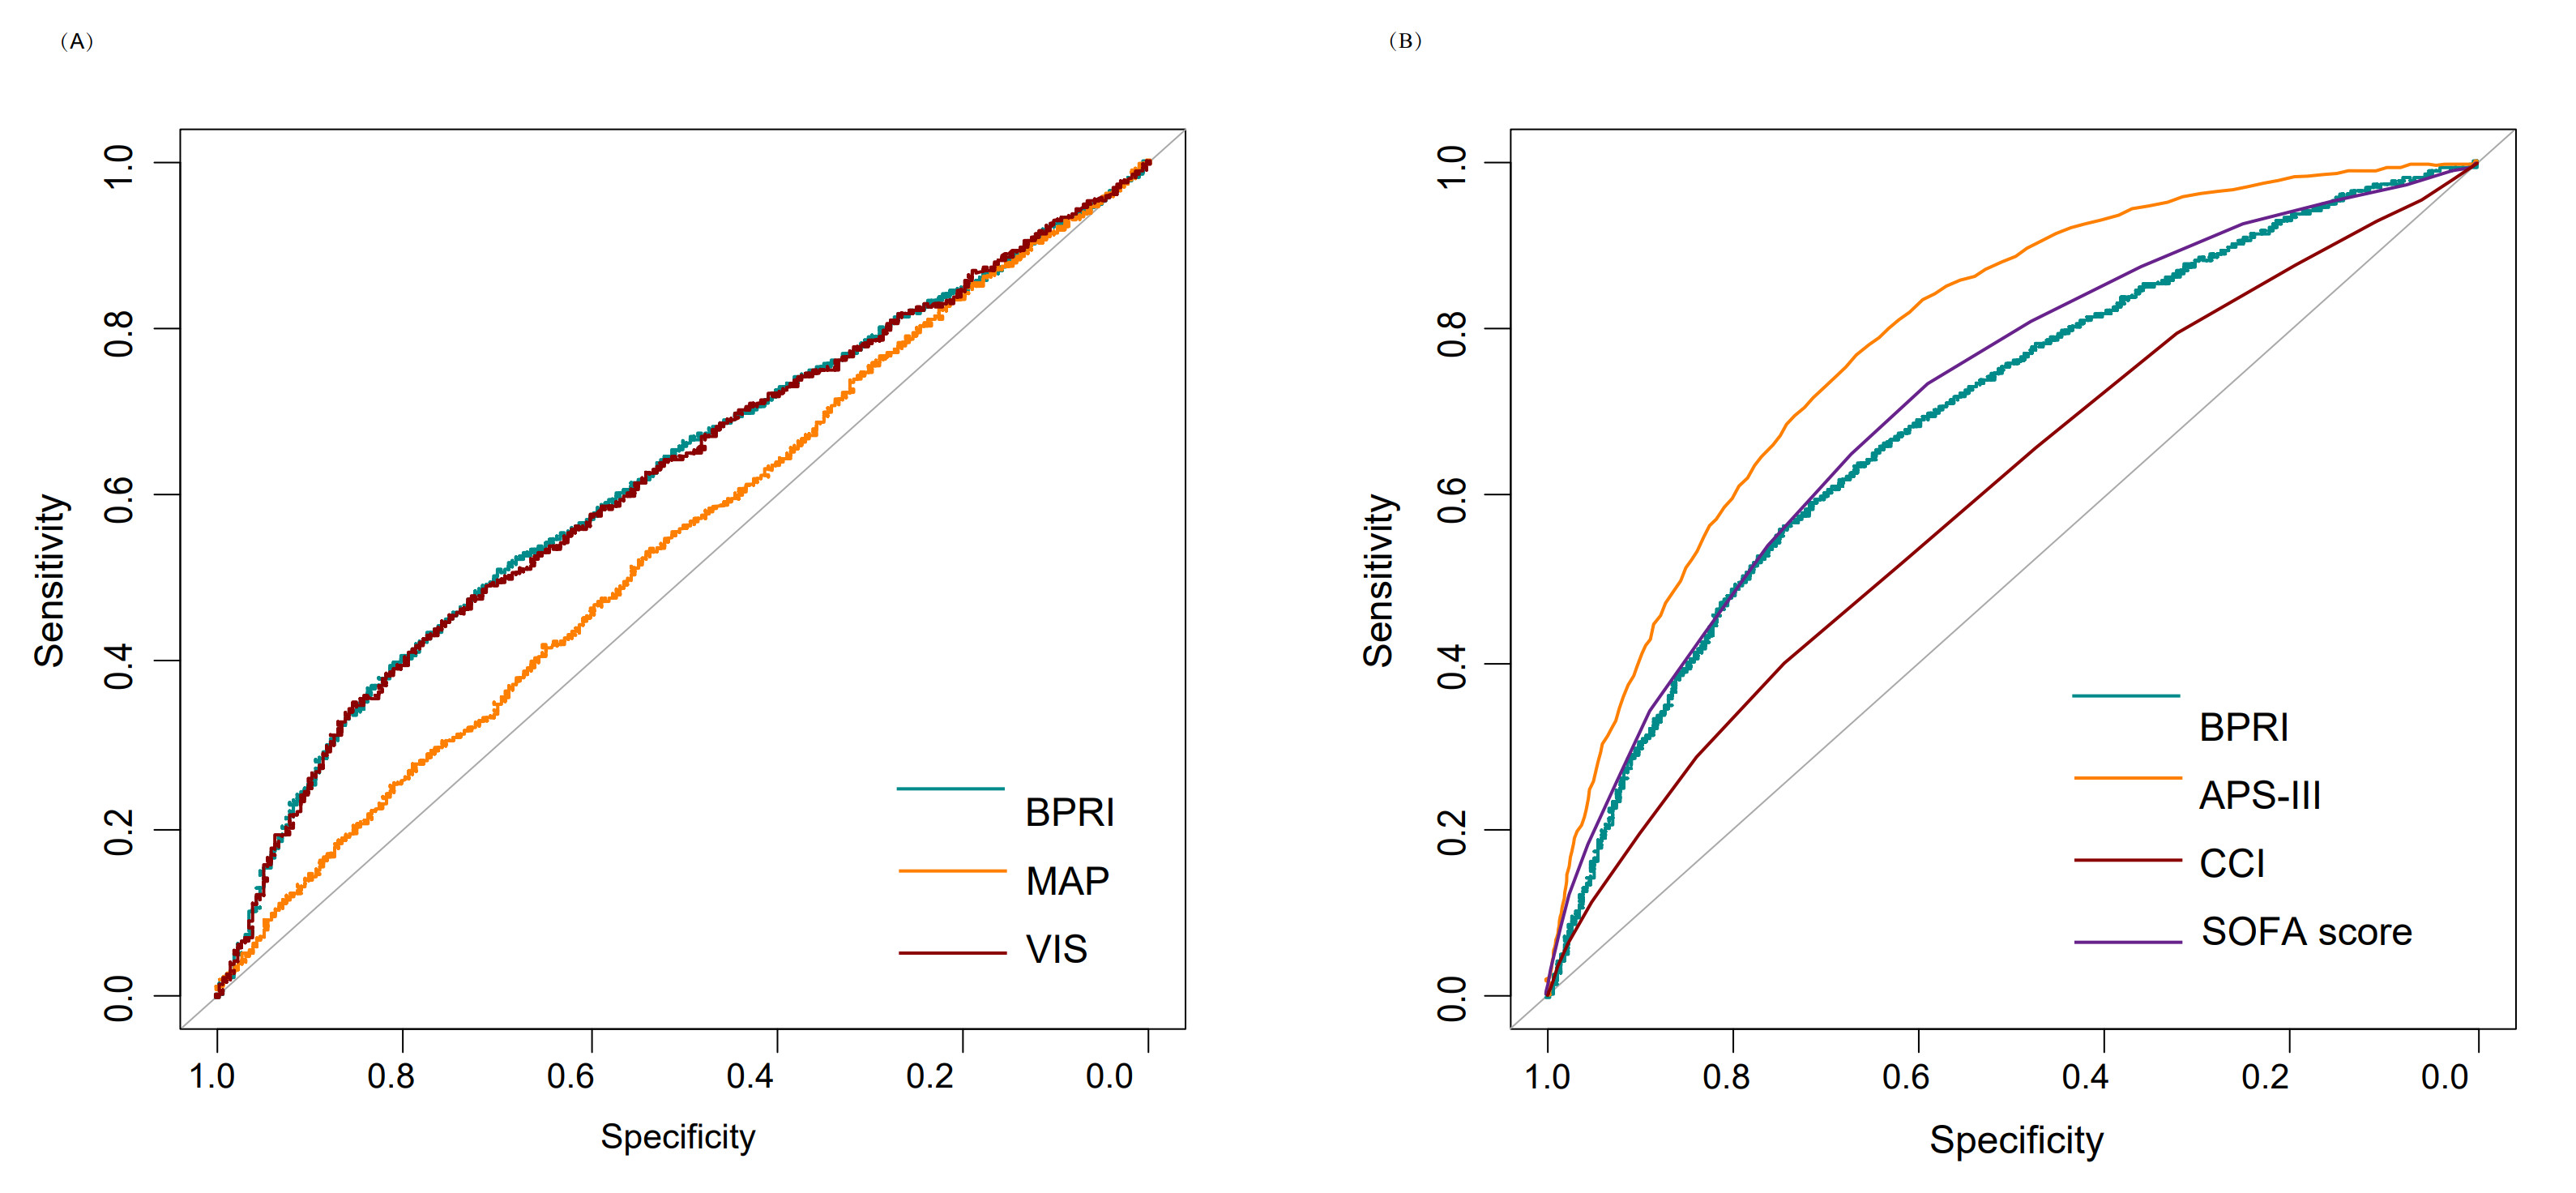
The results of the ROC curves showed that BPRI had a favorable predictive value for the development of AKI in patients with septic shock (AUC [95%CI], 0.624 [0.601, 0.639]). It was higher than the predictive efficacy of the constitutive variables MAP (AUC [95%CI], 0.542 [0.521, 0.563]) and VIS (AUC [95%CI], 0.618 [0.599, 0.637]). The BPRI demonstrated better predictive efficacy in predicting in-hospital death in patients (AUC [95%CI], 0.697 [0.681, 0.712]). In addition, when combined with the current commonly used disease severity scores, the predictive accuracy of APS-III and SOFA scores was also improved (Table 4, Figure 4).
Table 4. Predictive performance of each model for different outcomes.
| Models | AUC (95%CI) | Models | AUC (95%CI) | P for comparison |
|---|---|---|---|---|
| Occurrence of AKI | ||||
| BPRI | 0.624 (0.601, 0.639) | |||
| MAP | 0.542 (0.521, 0.563) | |||
| VIS | 0.618 (0.599, 0.637) | |||
| In-hospital mortality | ||||
| BPRI | 0.697 (0.681, 0.712) | |||
| APS-Ⅲ | 0.789 (0.777, 0.802) | +BPRI | 0.796 (0.783, 0.808) | <0.001 |
| SOFA score | 0.713 (0.699, 0.729) | +BPRI | 0.731 (0.717, 0.746) | <0.001 |
| CCI | 0.601 (0.584, 0.618) | +BPRI | 0.697 (0.682, 0.712) | 0.063 |
Note: AUC: area under the ROC curve; other abbreviations are as same as Table 1.
Figure 4. ROC curves for each variable in predicting the occurrence of AKI (A) and in-hospital all-cause mortality (B) in patients with septic shock. BPRI demonstrated favorable predictive value for both AKI occurrence (AUC 0.624) and in-hospital mortality (AUC 0.697), outperforming MAP and VIS alone for AKI prediction. When combined with existing disease severity scores (APS-III, SOFA), BPRI further improved predictive accuracy. BPRI, blood pressure response index; AKI, acute kidney injury; MAP, mean arterial pressure; VIS, vasoactive-inotropic score; AUC, area under the curve; ROC, receiver operating characteristic.
Subgroup analysis
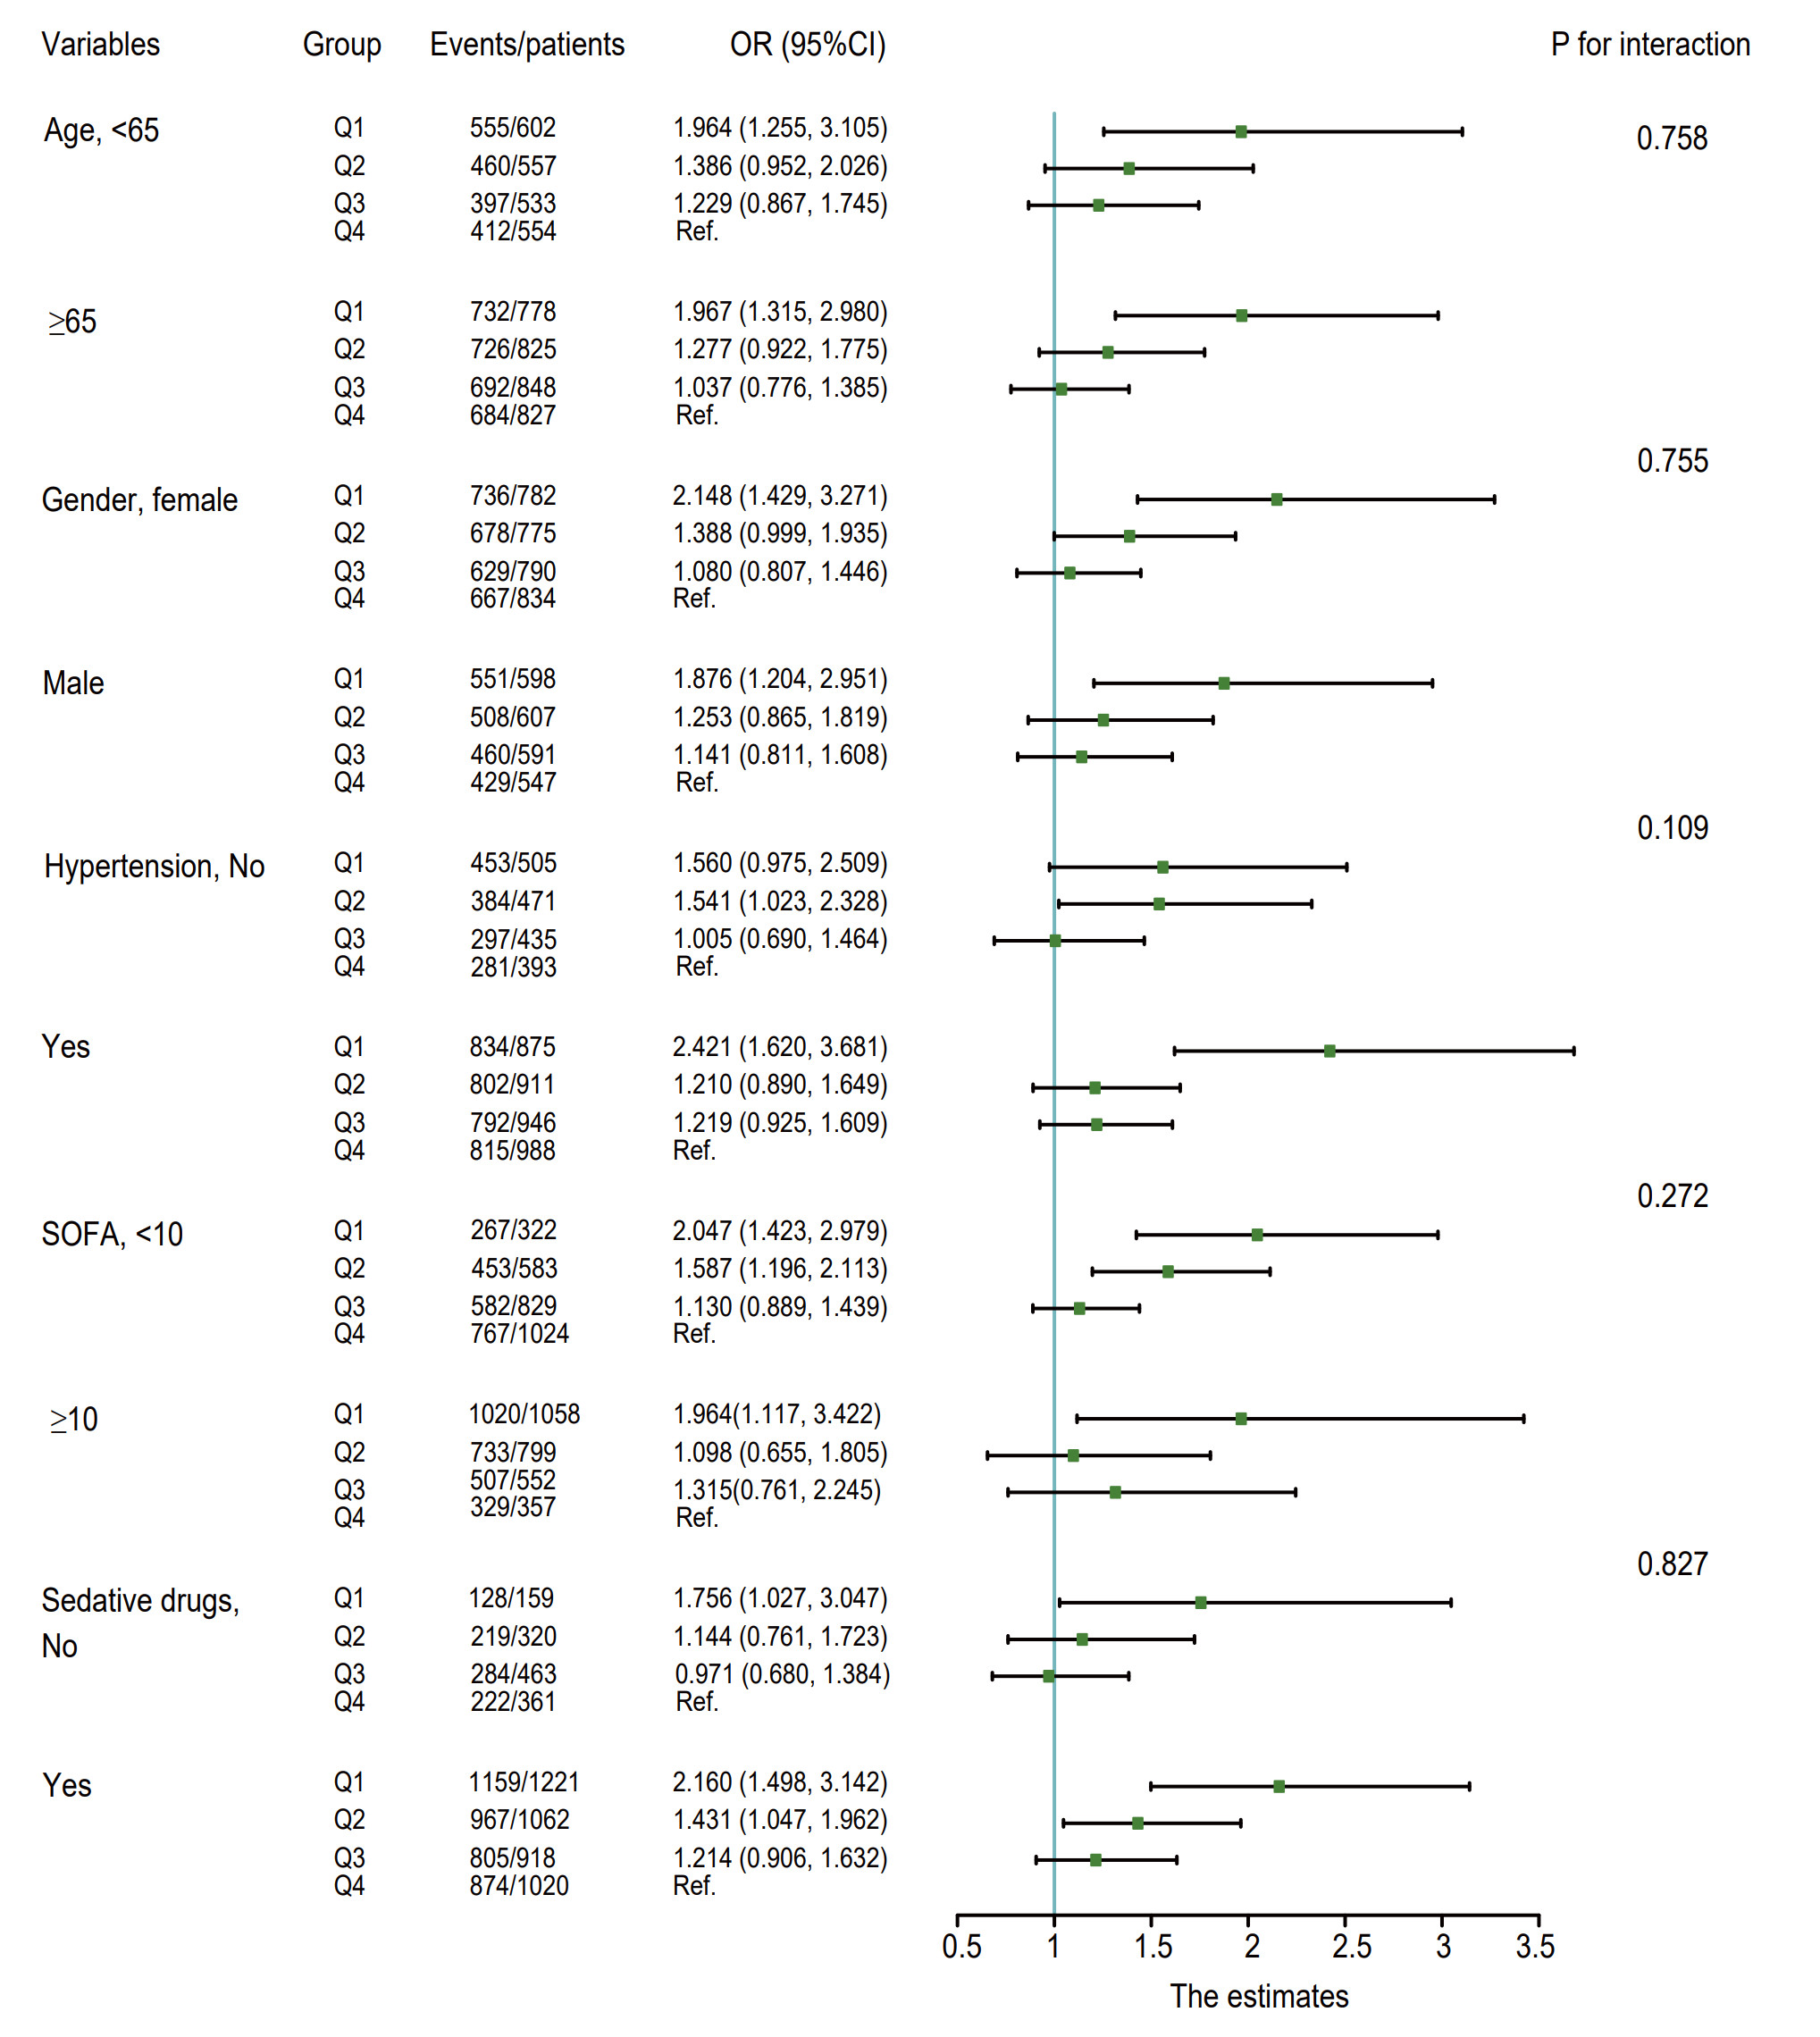
Subgroups of patients were analyzed using age, gender, hypertension, SOFA score, and sedative drugs as stratification factors. The results showed that in different populations, the risk of AKI was higher in groups Q1, Q2, and Q3 compared to group Q4. Interaction tests showed that there was no significant interaction between study variables and stratification factors (Figure 5).
Figure 5. Subgroup analysis with AKI incidence as outcome event. Forest plot showing subgroup analyses stratified by age, gender, hypertension, SOFA score, and sedative drug use. In all subgroups, patients in Q1, Q2, and Q3 groups showed higher AKI risk compared to Q4. Interaction tests showed no significant interaction between BPRI and stratification factors. AKI, acute kidney injury; BPRI, blood pressure response index; SOFA, sequential organ failure assessment; OR, odds ratio; CI, confidence interval.
Discussion
In this retrospective study of 5524 patients with septic shock, we found an overall "L" shaped association between BPRI levels and the risk of AKI. The inflection point was located at the 3.98 level, and on the left side of the inflection point, for every unit decrease in BPRI, the risk of AKI during ICU hospitalization increased by 18%. The lower the BPRI level, the greater the risk of severe AKI and the greater the chance of receiving RRT. Moreover, the lower the BPRI level, the longer the patient's hospital stay and the higher the short- and long-term mortality rates. In addition, BPRI has shown good predictive value in predicting the occurrence of AKI and in-hospital mortality. To our knowledge, this is the first study on the correlation between BPRI and the occurrence of AKI in septic shock patients. In response to the current high morbidity and mortality rates and the high risk of AKI in patients with septic shock, BPRI, as a simple assessment index, can be used in real-time and effectively to assess the risk of AKI and poor prognosis in patients with septic shock.
Renal perfusion insufficiency due to septic shock is the most important cause of AKI in these patients. The kidney is extremely sensitive to hypoxia, and the tubular epithelial cells in the thick segment of the ascending branch of the renal medullary collaterals have a very high oxygen extraction rate, and about 80% of the oxygen delivery is utilized by them [16]. Reduced oxygen supply to them due to decreased renal perfusion pressure makes them more susceptible to renal dysfunction [17]. In our study cohort, all patients with sepsis required treatment with vasoactive drugs and therefore exhibited a higher incidence of AKI relative to other studies [18, 19]. A prospective, exploratory cohort study found that in the early stages of diagnosis of infectious shock, patients in the group that developed AKI had significantly lower MAP levels than those in the group that did not develop AKI (MAP: 67±15 mmHg VS. 68±17 mmHg, P = 0.043) [20]. Meiping Wang et al. A prospective multicenter cohort study found that among patients with a diagnosis of sepsis and AKI, patients who developed early persistent AKI generally had a lower MAP than patients with late or early transient AKI [21].
As recommended by sepsis management guidelines, norepinephrine is commonly used as a first-line pressor-boosting agent in adult patients with septic shock [13]. In addition combination vasopressin therapy is recommended for patients whose MAP remains difficult to maintain, and positive inotropic agents such as dobutamine are often required for patients with concomitant cardiac insufficiency. The use of vasoactive drugs in patients with infectious shock and the patient's response to the drugs have some individual differences [22, 23]. The VIS score can be used to quantitatively assess the strength of hemodynamic support. A retrospective study of 1935 adult patients undergoing cardiovascular surgery found that VIS was strongly associated with the development of postoperative AKI in patients (OR [95% CI], 1.191 [1.11, 1.34], P < 0.001) [24]. The BPRI combines hemodynamic status and support strength and can be used to accurately respond to a patient's response to vasoactive medications. In our study, we found that when the BPRI was below the level of 3.98, the risk of AKI in patients increased sharply with the decrease in BPRI. More attention needs to be paid to such patients even in the presence of circulatory stabilization.
The current diagnosis of AKI is based primarily on increased SCr or decreased urine output. However, sepsis also reduces peripheral perfusion, causing a decrease in muscle blood supply, which results in a decrease in creatine production, leading to a lag in the increase in serum creatinine compared to the actual impairment of renal function [25, 26]. And decreased urine output may also be diluted by aggressive fluid resuscitation as well as diuretic use, resulting in failure to diagnose AKI in a timely manner [27]. It is difficult to avoid delays in developing a diagnosis and implementing treatment that are based on the fact that renal failure has already occurred. In patients with septic shock, accurate assessment of renal perfusion status is critical for effective prevention of AKI [28]. Currently, ultrasonic Doppler is most commonly used to approximate renal perfusion by measuring the resistivity index of the interlobar arteries [29]. However, ultrasound Doppler results are more dependent on the skill and experience of the operator. Different pathologies (e.g., renal artery stenosis) may result in similar ultrasound presentations, which adds to the complexity of clinical judgment [30]. Furthermore, abdominal ultrasound can be affected by conditions such as obesity or the presence of abdominal and intestinal gas, which can affect the accuracy of the measurements [31]. Our study found that BPRI levels were closely associated with the occurrence of AKI. Perhaps, BPRI, as an indicator to assess the vascular status of patients, can reflect the perfusion status of the kidney to some extent. This needs to be verified by subsequent prospective studies.
There are also some limitations to this study. The first is the BPRI itself. Since the vast majority of patients were diagnosed with sepsis and on vasoactive medications on the same day they were admitted to the ICU, it was difficult for us to determine their baseline MAP levels. Although we included hypertension, HF, and other factors that may have an effect on baseline blood pressure levels in our multifactorial analysis and assessed the hypertensive and non-hypertensive populations during subgroup analyses. However, differences in patients' baseline MAP levels may still have an impact on early BPRI levels in patients with septic shock. Second, even though there was a sufficiently large sample size, this study was a single-center retrospective study, and the conclusions obtained need to be validated by a multicenter prospective study.
Conclusions
We found an overall "L" shaped association between BPRI levels and the risk of AKI in patients with septic shock. When BPRI was less than 3.98, the risk of AKI in patients increased dramatically. The BPRI also showed good predictive value in predicting AKI occurrence and in-hospital mortality. As a simple and effective evaluation index, the BPRI can help clinicians identify patients at potentially high risk of AKI.
Abbreviations
AKI, Acute Kidney Injury; APS-III, Acute Physiology Score III; AUC, Area Under the Curve; BPRI, Blood Pressure Response Index; BUN, Blood Urea Nitrogen; CCI, Charlson Comorbidity Index; CHD, Coronary Heart Disease; CI, Confidence Interval; CKD, Chronic Kidney Disease; CLD, Chronic Liver Disease; COPD, Chronic Obstructive Pulmonary Disease; DM, Diabetes Mellitus; GCS, Glasgow Coma Scale; Hb, Hemoglobin; HF, Heart Failure; HR, Hazard Ratio; ICU, Intensive Care Unit; IMV, Invasive Mechanical Ventilation; MAP, Mean Arterial Pressure; MIMIC-IV, Medical Information Mart for Intensive Care IV; OR, Odds Ratio; PLT, Platelet; RCS, Restricted Cubic Spline; ROC, Receiver Operating Characteristic; RRT, Renal Replacement Therapy; SCr, Serum Creatinine; SOFA, Sequential Organ Failure Assessment; VIS, Vasoactive-Inotropic Score; WBC, White Blood Cell.
Declarations
Author Contributions
J.H.L., X.H.C., and L.Y. conceived and designed the research, and also participated in the review and revision of the manuscript. J.H.L. and X.H.C. drafted the initial manuscript and collected the data. Z.H.H. and J.L.W. conducted the data analysis and interpretation. All authors read and approved the final draft.
Acknowledgements
We are grateful to all the developers and researchers who created and maintained the MIMIC-IV database.
Funding Information
Not Applicable.
Ethics Approval and Consent to Participate
This study for the MIMIC-IV database was approved by the review boards of the Massachusetts Institute of Technology and Beth Israel Deaconess Medical Center, and the patient information was de-identified so that there were no ethical concerns.
Competing Interests
The authors declare that they have no existing or potential commercial or financial relationships that could create a conflict of interest at the time of conducting this study.
Data Availability
All data needed to evaluate the conclusions in the paper are present in the paper or the Supplementary Materials. Additional data related to this paper may be requested from the authors.
References
 Figures
 References
 Peer
Peer Information
Figure 1. Flow chart. The flow chart illustrates the patient selection process for the study. Patients with septic shock from the MIMIC-IV database were screened according to predefined inclusion and exclusion criteria, resulting in a final cohort of 5524 patients for analysis.
Figure 2. Kaplan-Meyer survival analysis at 30 (A), 180 (B), and 365 days (C) for four groups of patients. Survival curves are stratified by BPRI quartile groups (Q1–Q4). A stepwise distribution of survival rates was observed across groups, with the Q1 group (lowest BPRI) showing the lowest survival rates at all time points. BPRI, blood pressure response index.
Figure 3. Correlation between BPRI and AKI incidence odds ratio in unadjusted model (A) and adjusted model 3 (B). Restricted cubic spline (RCS) curves show an "L"-shaped association between BPRI levels and the risk of AKI occurrence. The inflection point is located at BPRI = 3.98. On the left side of the inflection point, AKI risk decreases significantly as BPRI increases. On the right side, no statistically significant association was observed. BPRI, blood pressure response index; AKI, acute kidney injury; OR, odds ratio; CI, confidence interval.
Figure 4. ROC curves for each variable in predicting the occurrence of AKI (A) and in-hospital all-cause mortality (B) in patients with septic shock. BPRI demonstrated favorable predictive value for both AKI occurrence (AUC 0.624) and in-hospital mortality (AUC 0.697), outperforming MAP and VIS alone for AKI prediction. When combined with existing disease severity scores (APS-III, SOFA), BPRI further improved predictive accuracy. BPRI, blood pressure response index; AKI, acute kidney injury; MAP, mean arterial pressure; VIS, vasoactive-inotropic score; AUC, area under the curve; ROC, receiver operating characteristic.
Figure 5. Subgroup analysis with AKI incidence as outcome event. Forest plot showing subgroup analyses stratified by age, gender, hypertension, SOFA score, and sedative drug use. In all subgroups, patients in Q1, Q2, and Q3 groups showed higher AKI risk compared to Q4. Interaction tests showed no significant interaction between BPRI and stratification factors. AKI, acute kidney injury; BPRI, blood pressure response index; SOFA, sequential organ failure assessment; OR, odds ratio; CI, confidence interval.
Peer-review Terminology
Identity transparency: Single anonymized
Reviewer interacts with: Editor
Details
This is an open access article under the terms of the Creative Commons Attribution License(http://creativecommons.org/licenses/by/4.0/), which permits use, distribution and reproduction in any medium, provided the original work is properly cited.
Publication History
Received 2026-01-19
Accepted 2026-04-15
Published 2026-05-26