


Abstract
 >
>
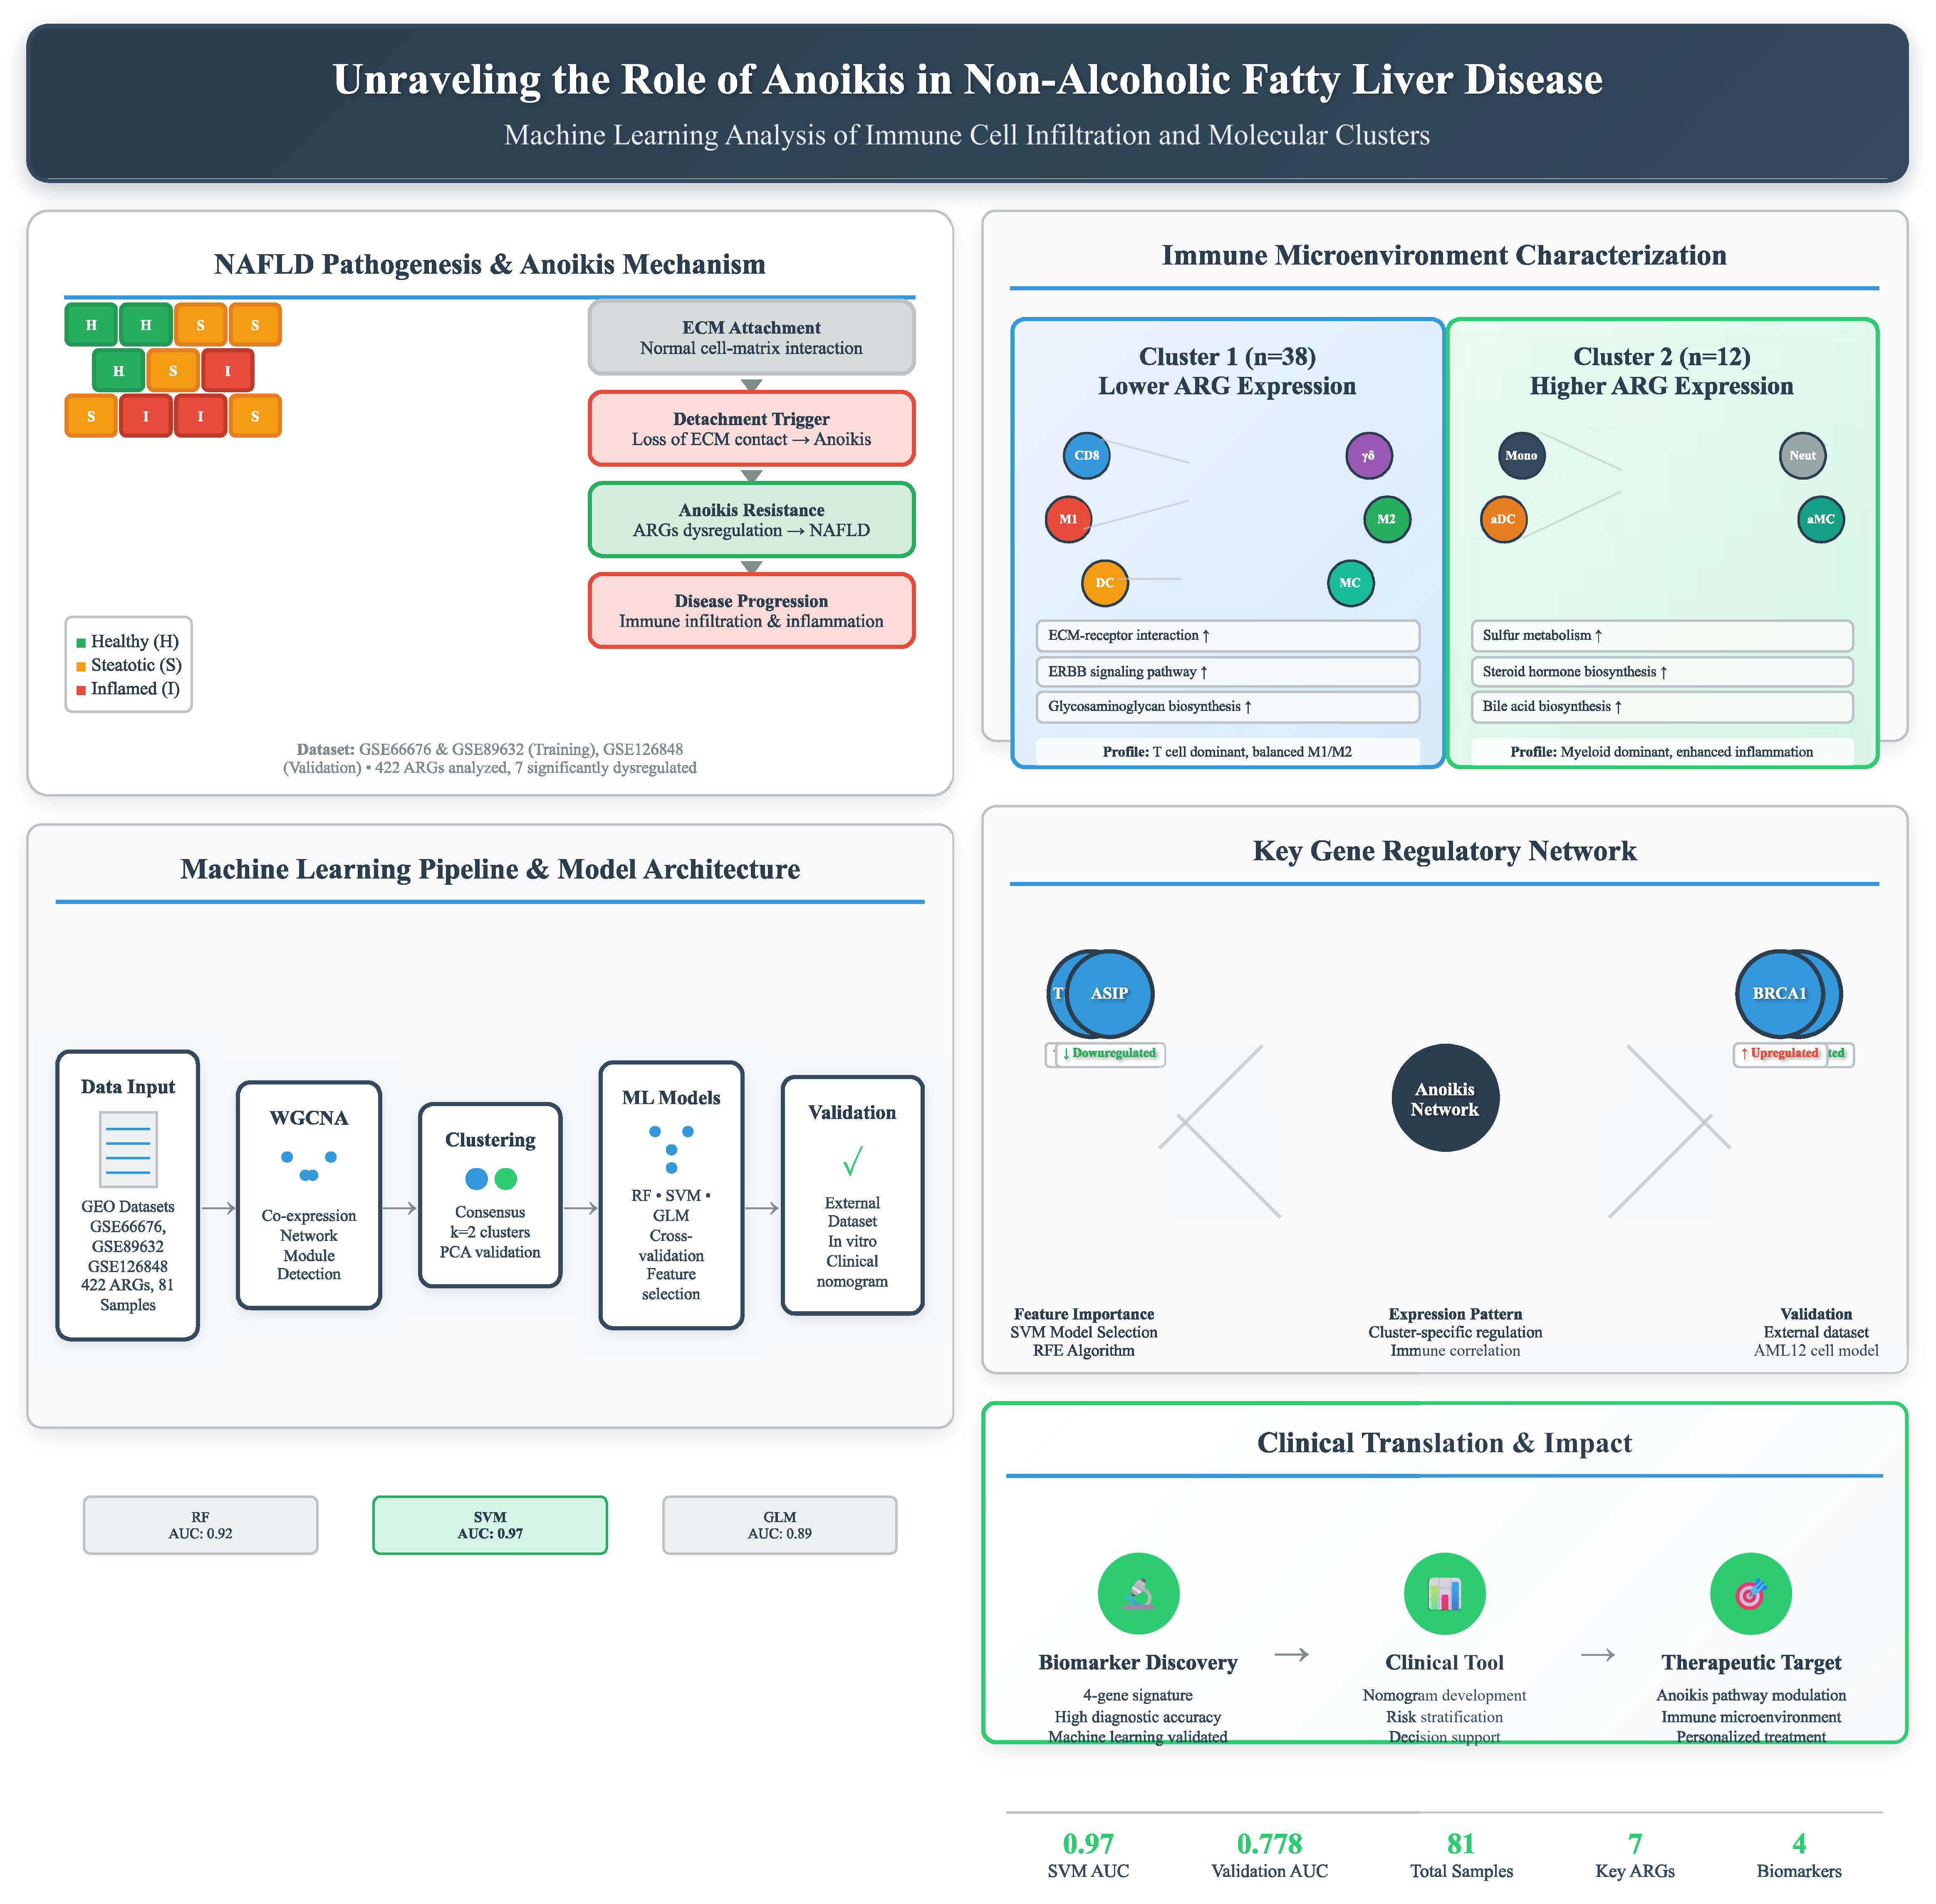
Background:Non-alcoholic fatty liver disease (NAFLD) is a prevalent chronic liver disease with complex molecular mechanisms. Anoikis, a distinct form of programmed cell death, has been implicated in disease progression, but its specific role in NAFLD remains unclear. This study aims to identify anoikis-related molecular clusters, explore their immune characteristics, and construct a predictive model for NAFLD prognosis.
Methods:Gene expression profiles of NAFLD samples were obtained from the Gene Expression Omnibus (GEO) database. Weighted gene co-expression network analysis (WGCNA) was applied to identify cluster-specific differentially expressed genes. Immune infiltration analysis was conducted to evaluate the association between anoikis-related clusters and immune cell composition. Machine learning was used to screen feature genes, and a predictive model was developed. The model’s performance was assessed using nomograms, calibration curves, and decision curve analysis (DCA).
Results:Two distinct anoikis-related molecular clusters were identified, each exhibiting unique immune microenvironment characteristics. Cluster 1 showed higher levels of CD8 T cells, γ-delta T cells, and macrophages (M1 and M2), while Cluster 2 had increased monocytes, activated dendritic cells, and neutrophils, reflecting inflammatory heterogeneity. Four key genes (TMEM169, THBS1, ASIP, and BRCA1) were identified through machine learning and incorporated into a predictive model. The model’s accuracy in predicting NAFLD prognosis was confirmed through nomograms, calibration curves, and DCA.
Conclusion:This study established an anoikis-related prognostic model for NAFLD and identified key genes involved in disease progression. The findings provide novel insights into the interplay between anoikis, immune responses, and NAFLD, offering potential biomarkers and therapeutic targets for personalized treatment.
Keywords:NAFLD, Anoikis, Apoptosis, Machine learning
Introduction
Non-alcoholic fatty liver disease (NAFLD), characterized by inflammation, has rapidly emerged as the leading cause of chronic liver disease globally[1] . Because of the rising incidence of metabolic syndrome, obesity, and diabetes worldwide, NAFLD now affected approximately one-quarter of the global population[2] . Regional variations exist, with the highest prevalence observed in the Middle East (32%) and South America (30%), followed by North America and Europe (24%), Asia (27%), and the lowest in Africa (13%) [3] . NAFLD is defined as a spectrum of diseases where more than 5% of hepatocytes exhibit steatosis alongside metabolic risk factors, notably obesity. NAFLD represents the hepatic manifestation of metabolic syndrome and is classified histologically into nonalcoholic fatty liver (NAFL) and nonalcoholic steatohepatitis (NASH)[4] . Despite extensive research, the pathogenesis of NAFLD remains poorly understood, underscoring the urgent need for reliable biomarkers for its diagnosis.
Apoptosis, a fundamental organismal defense mechanism, curtails abnormal cell proliferation by preventing the reattachment of detached cells[5] . Emerging studies highlighted the significant role of apoptosis in NAFLD [6–8] . Anoikis, a specific form of apoptosis triggered by cell detachment from the extracellular matrix (ECM), is critical for tissue homeostasis and development, originally identified in endothelial and epithelial cells.
The regulatory mechanisms underlying anoikis in NAFLD remain elusive, warranting further investigation. In this context, we conducted a comprehensive analysis utilizing publicly available databases and bioinformatics tools to identify anoikis-related genes (ARGs) implicated in NAFLD onset and progression. Subsequent analyses focused on the regulatory networks of ARGs and their associations with the immune microenvironment. This research aims to elucidate the function of ARGs in NAFLD and identify novel therapeutic targets.
Methods and materials
Data collection and processing
The datasets GSE66766, GSE89632, and GSE126848 were obtained from the Gene Expression Omnibus (GEO) database (http://www.ncbi.nlm.nih.gov/geo/). GSE66676 was generated using the GPL66244 platform and comprised 67 samples, including 34 normal liver tissue controls and 33 NAFLD tissue samples. The GSE89632 dataset, based on the GPL14951 platform, contained 63 samples, of which 24 were normal liver controls and 39 were NAFLD tissue samples. All samples were included in the current analysis, with quality control ensuring the removal of samples with >10% missing values or low-quality metrics, such as inadequate signal intensity or inconsistent replicates. Additionally, GSE126848, utilizing the GPL14877 platform, included 57 samples, consisting of 26 normal liver controls and 31 NAFLD tissue samples, and was employed as the validation set in this study. Batch effects in the integrated datasets (GSE66676 and GSE89632) were adjusted using the "SVA" package, employing parameters that accounted for known covariates, such as platform differences. Missing values in the datasets were imputed using k-nearest neighbor (KNN) imputation. A power analysis was performed to confirm the adequacy of sample sizes, ensuring statistical reliability for downstream analyses.
Evaluating the immune cell infiltration
CIBERSORT was employed using the LM22 signature matrix to estimate the immune cell subtype composition for each sample based on gene expression profiles. The p-value for each sample was calculated using Monte Carlo sampling to assess the statistical significance of the deconvolution results. Differences in immune cell abundance between groups were evaluated using the Wilcoxon rank-sum test. In this study, a p-value < 0.05 was considered statistically significant.
Correlation analysis of ARGs and immune cell infiltration
To further validate the association between ARG expression and immune cell characteristics related to NAFLD, the correlation between ARG expression levels and the relative proportions of immune cells was analyzed. Spearman’s correlation coefficient and the corresponding p-value were calculated to assess the strength and significance of the associations, with a p-value < 0.05 considered statistically significant. The results were visualized using the 'corrplot' R package (version 0.92).
Unsupervised clustering of NAFLD patients
Anoikis-related genes (ARGs) were retrieved from the GeneCard database (https://www.genecards.org/), resulting in a consistent set of 422 genes across all cohorts (Supplementary Table 1). To investigate the molecular heterogeneity of non-alcoholic fatty liver disease (NAFLD), an unsupervised clustering analysis was performed based on the expression profiles of seven cuproptosis-associated genes with significantly altered expression. This analysis, conducted using the k-means algorithm across 1000 iterations, classified 50 NAFLD samples into distinct clusters. The maximum number of subtypes was set at k = 9, and the optimal number of subtypes was determined using a combination of the cumulative distribution function (CDF) curve, consensus matrix, and consensus cluster score (>0.9). Principal Component Analysis (PCA) further demonstrated distinct anoikis-related patterns across the subtypes, with the results visualized using the ‘ggplot2’ package.
Gene set variation analysis (GSVA) analysis
The enrichment analysis of different ARG clusters was conducted using the GSVA R package (version 2.11). For further GSVA analysis, the ‘c2.cp.kegg. v7.4.symbols’ and ‘c5.go.bp.v7.5.1.symbols’ files were obtained from the MSigDB database. Differentially enriched pathways and biological functions between ARG clusters were identified by comparing GSVA scores, using the ‘LIMMA’ R package (version 3.52.1) to assess statistical significance.
Weighted gene co-expression network analysis (WGCNA)
Based on gene clustering, weighted gene co-expression network analysis (WGCNA) was applied to identify highly correlated gene modules in NAFLD samples across gene subgroups [9] . Concurrently, WGCNA was performed on the combined dataset of normal and NAFLD samples to identify shared gene modules. By intersecting the results from disease-specific WGCNA and anoikis-related gene WGCNA, we identified NAFLD gene modules significantly associated with anoikis. The "good Samples Genes" function was employed to filter out low-quality genes and samples. An appropriate soft-thresholding power (β) was selected to compute the adjacency matrix, ensuring scale-free topology. Co-expression modules were then identified through hierarchical clustering and the dynamic tree cut algorithm, with a minimum module size set at 100 genes. Module eigengenes were subsequently calculated to represent the expression profiles of each module, and the eigengene network was visualized to illustrate the relationships between modules.
Construction of multiple machine learning prediction models
Using two distinct ARG clusters, machine learning models were constructed with the ‘caret’ R package (version 6.0.91), including the random forest (RF), support vector machine (SVM), and generalized linear model (GLM). RF leverages multiple independent decision trees for classification or regression tasks [10] , while SVM creates a hyperplane with maximum margin to separate positive from negative instances in the feature space [11] . The GLM, an extension of linear regression, estimates relationships between normally distributed correlated features and categorical or continuous independent variables [12] . Feature selection was performed using recursive feature elimination (RFE) with 10-fold cross-validation to identify the most informative features, minimizing overfitting. Cross-validation was implemented using stratified 5-fold validation to ensure balanced representation of clusters across splits. Model parameter optimization was conducted using a grid search approach combined with cross-validation to select the best hyperparameters. Model comparison was based on performance metrics, including accuracy, precision, recall, F1-score, and area under the receiver operating characteristic (AUC-ROC) curve, providing a comprehensive evaluation.
The 50 NAFLD samples were randomly split into a training set (70%, n = 35) and a validation set (30%, n = 15). Model parameters were automatically optimized, and all models were evaluated through 5-fold cross-validation. The ‘Dalex’ package (version 2.4.0) was employed to interpret the models, providing insights into residual distribution and feature importance. The area under the receiver operating characteristic (ROC) curve was visualized using the ‘proc’ R package(version1.18.0). The optimal model was selected based on performance metrics, and the top five predictive genes associated with NAFLD were identified as key variables.
Analysis of the diagnostic value of biomarkers
The receiver operating characteristic (ROC) curve was generated using the ‘pROC’ R package, and the area under the ROC curve (AUC) was calculated to assess model performance. The discriminatory ability of the key predictor genes in distinguishing NAFLD from non-NAFLD was externally validated using the GSE126848 dataset.
Construction and validation of nomogram models
Eigengenes were combined to construct nomograms using the ‘rms’ R package. The accuracy of the nomogram was then evaluated through a calibration curve, comparing predicted versus observed outcomes. Additionally, decision curve analysis was performed to assess the clinical utility of the nomogram, determining its net benefit across different threshold probabilities.
Cell culture
AML12 cells were maintained in a 5% CO2 incubator at 37°C, supplemented with 10% fetal bovine serum (FBS, Gibco, USA) and 1% penicillin-streptomycin (Gibco). To model non-alcoholic fatty liver disease (NAFLD) in vitro, hepatocytes were exposed to a medium containing 0.25 mM palmitic acid (PA, Sigma-Aldrich) and 0.5 mM oleic acid (OA, MedChemExpress) for the indicated durations. A fatty acid-free bovine serum albumin control was used to assess baseline conditions.
Oil red O staining
Oil Red O staining was performed to evaluate lipid droplet formation in AML12 cells, following a previously established protocol [13] . In brief, cells were washed twice with PBS, fixed in 4% paraformaldehyde for 30 minutes, and then stained with a 0.5% Oil Red O solution prepared in 60% isopropanol for 30 minutes. After staining, cells were rinsed with PBS before imaging. Lipid droplets were visualized and images were captured using an inverted microscope (ZEISS Corporation) at 100× magnification.
Statistical analysis
All data are expressed as the mean ± standard deviation (SD). Statistical comparisons between groups were conducted using an unpaired two-tailed Student's t-test. A p-value of less than 0.05 was considered statistically significant. All statistical analyses were performed using GraphPad Prism 8 (GraphPad Software, San Diego, USA) and R software (version 4.2.2; https://www.r-project.org/).
Results
Identifying AR‑DEGs in Patients with NAFLD
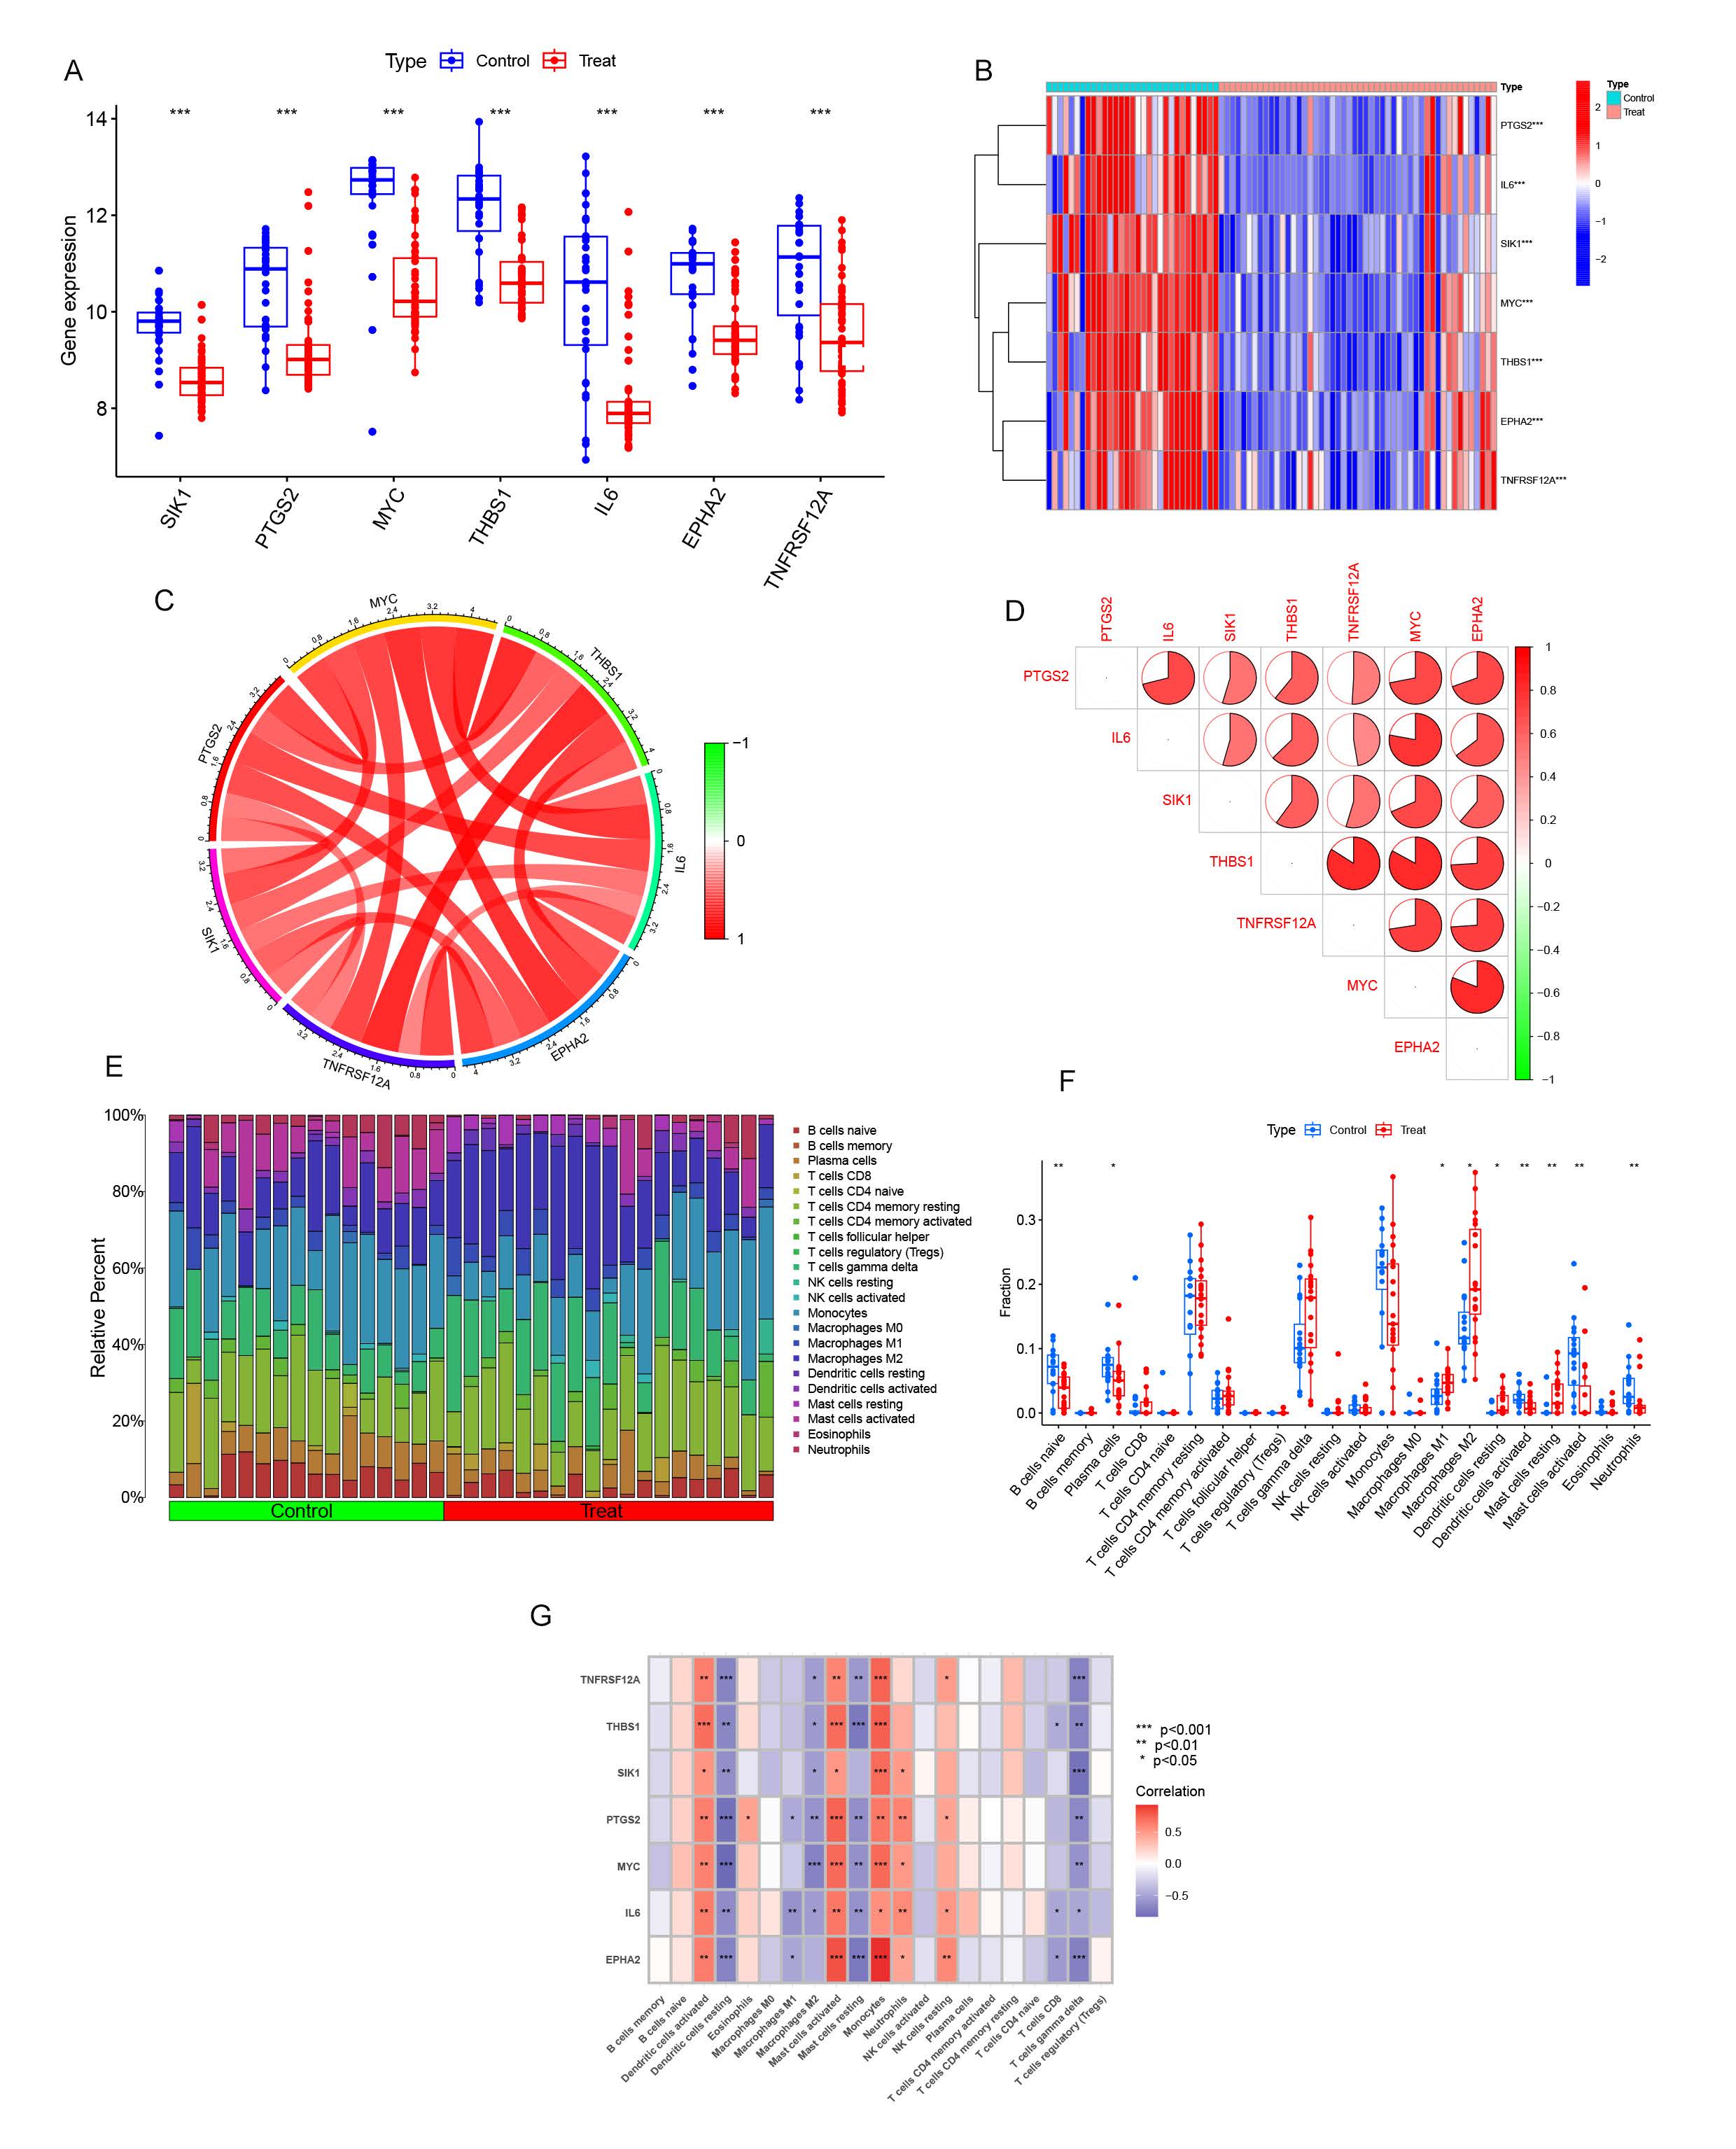
The microarray datasets GSE63067 and GSE89632 were obtained from the Gene Expression Omnibus (GEO) database to elucidate the biological functions of anoikis regulators in the development and progression of non-alcoholic fatty liver disease (NAFLD). We assessed the expression profiles of 422 anoikis-associated genes between NAFLD and non-NAFLD controls using a merged dataset that was successfully cleared of batch effects(S-Figure1A-D). This dataset included 50 NAFLD tissues and 31 normal liver tissues. Seven significant differential expression genes were identified as key anoikis regulators: SIK1, PTGS2, MYC, THBS1, IL6, EPHA2, and TNFRSF12A (Figure 1A-B). Notably, these genes exhibited elevated expression in NAFLD patients compared to non-NAFLD controls. Correlation analysis of the differentially expressed anoikis genes revealed a strong synergistic interaction between THBS1 and TNFRSF12A (Figure 1C-D). Further investigation into these correlations highlighted the complex interplay among these genes. Immune infiltration analysis, utilizing the CiberSort algorithm, visualized differences in the proportions of 22 infiltrating immune cell types between NAFLD and non-NAFLD subjects (Figure 1E). The results indicated higher levels of M1 macrophages, M2 macrophages, and resting mast cells in NAFLD tissues, suggesting that immune system alterations are implicated in NAFLD pathogenesis. Additionally, correlation analysis revealed associations between anoikis-related genes and various immune cell types, including resting dendritic cells, activated dendritic cells, resting mast cells, activated mast cells, and γ-delta T cells (Figure 1F). These findings underscore the significant role of anoikis-related genes in modulating immune infiltration and highlight their potential impact on the development and progression of NAFLD.
Figure1. Expression of ARGs in NAFLD. (A) Boxplots illustrating the differential expression of seven ARGs between NAFLD patients and non-NAFLD controls, with significance levels denoted as p < 0.05, *p < 0.01, **p < 0.001, and ns indicating no significance. (B) Heatmap showing the expression patterns of the seven ARGs (C) Correlation analysis of nine differentially expressed CRGs. (D) Gene interaction network of the seven differentially expressed ARGs. (E) Comparative analysis of the relative abundance of 22 infiltrating immune cell types between NAFLD and non-NAFLD controls. (F) Boxplots representing differences in immune cell infiltration between NAFLD and non-NAFLD cohorts, with significance levels as p < 0.05, *p < 0.01, **p < 0.001, and ns indicating no significance. (G) Correlation analysis between the expression of seven differentially expressed ARGs and infiltrating immune cells.
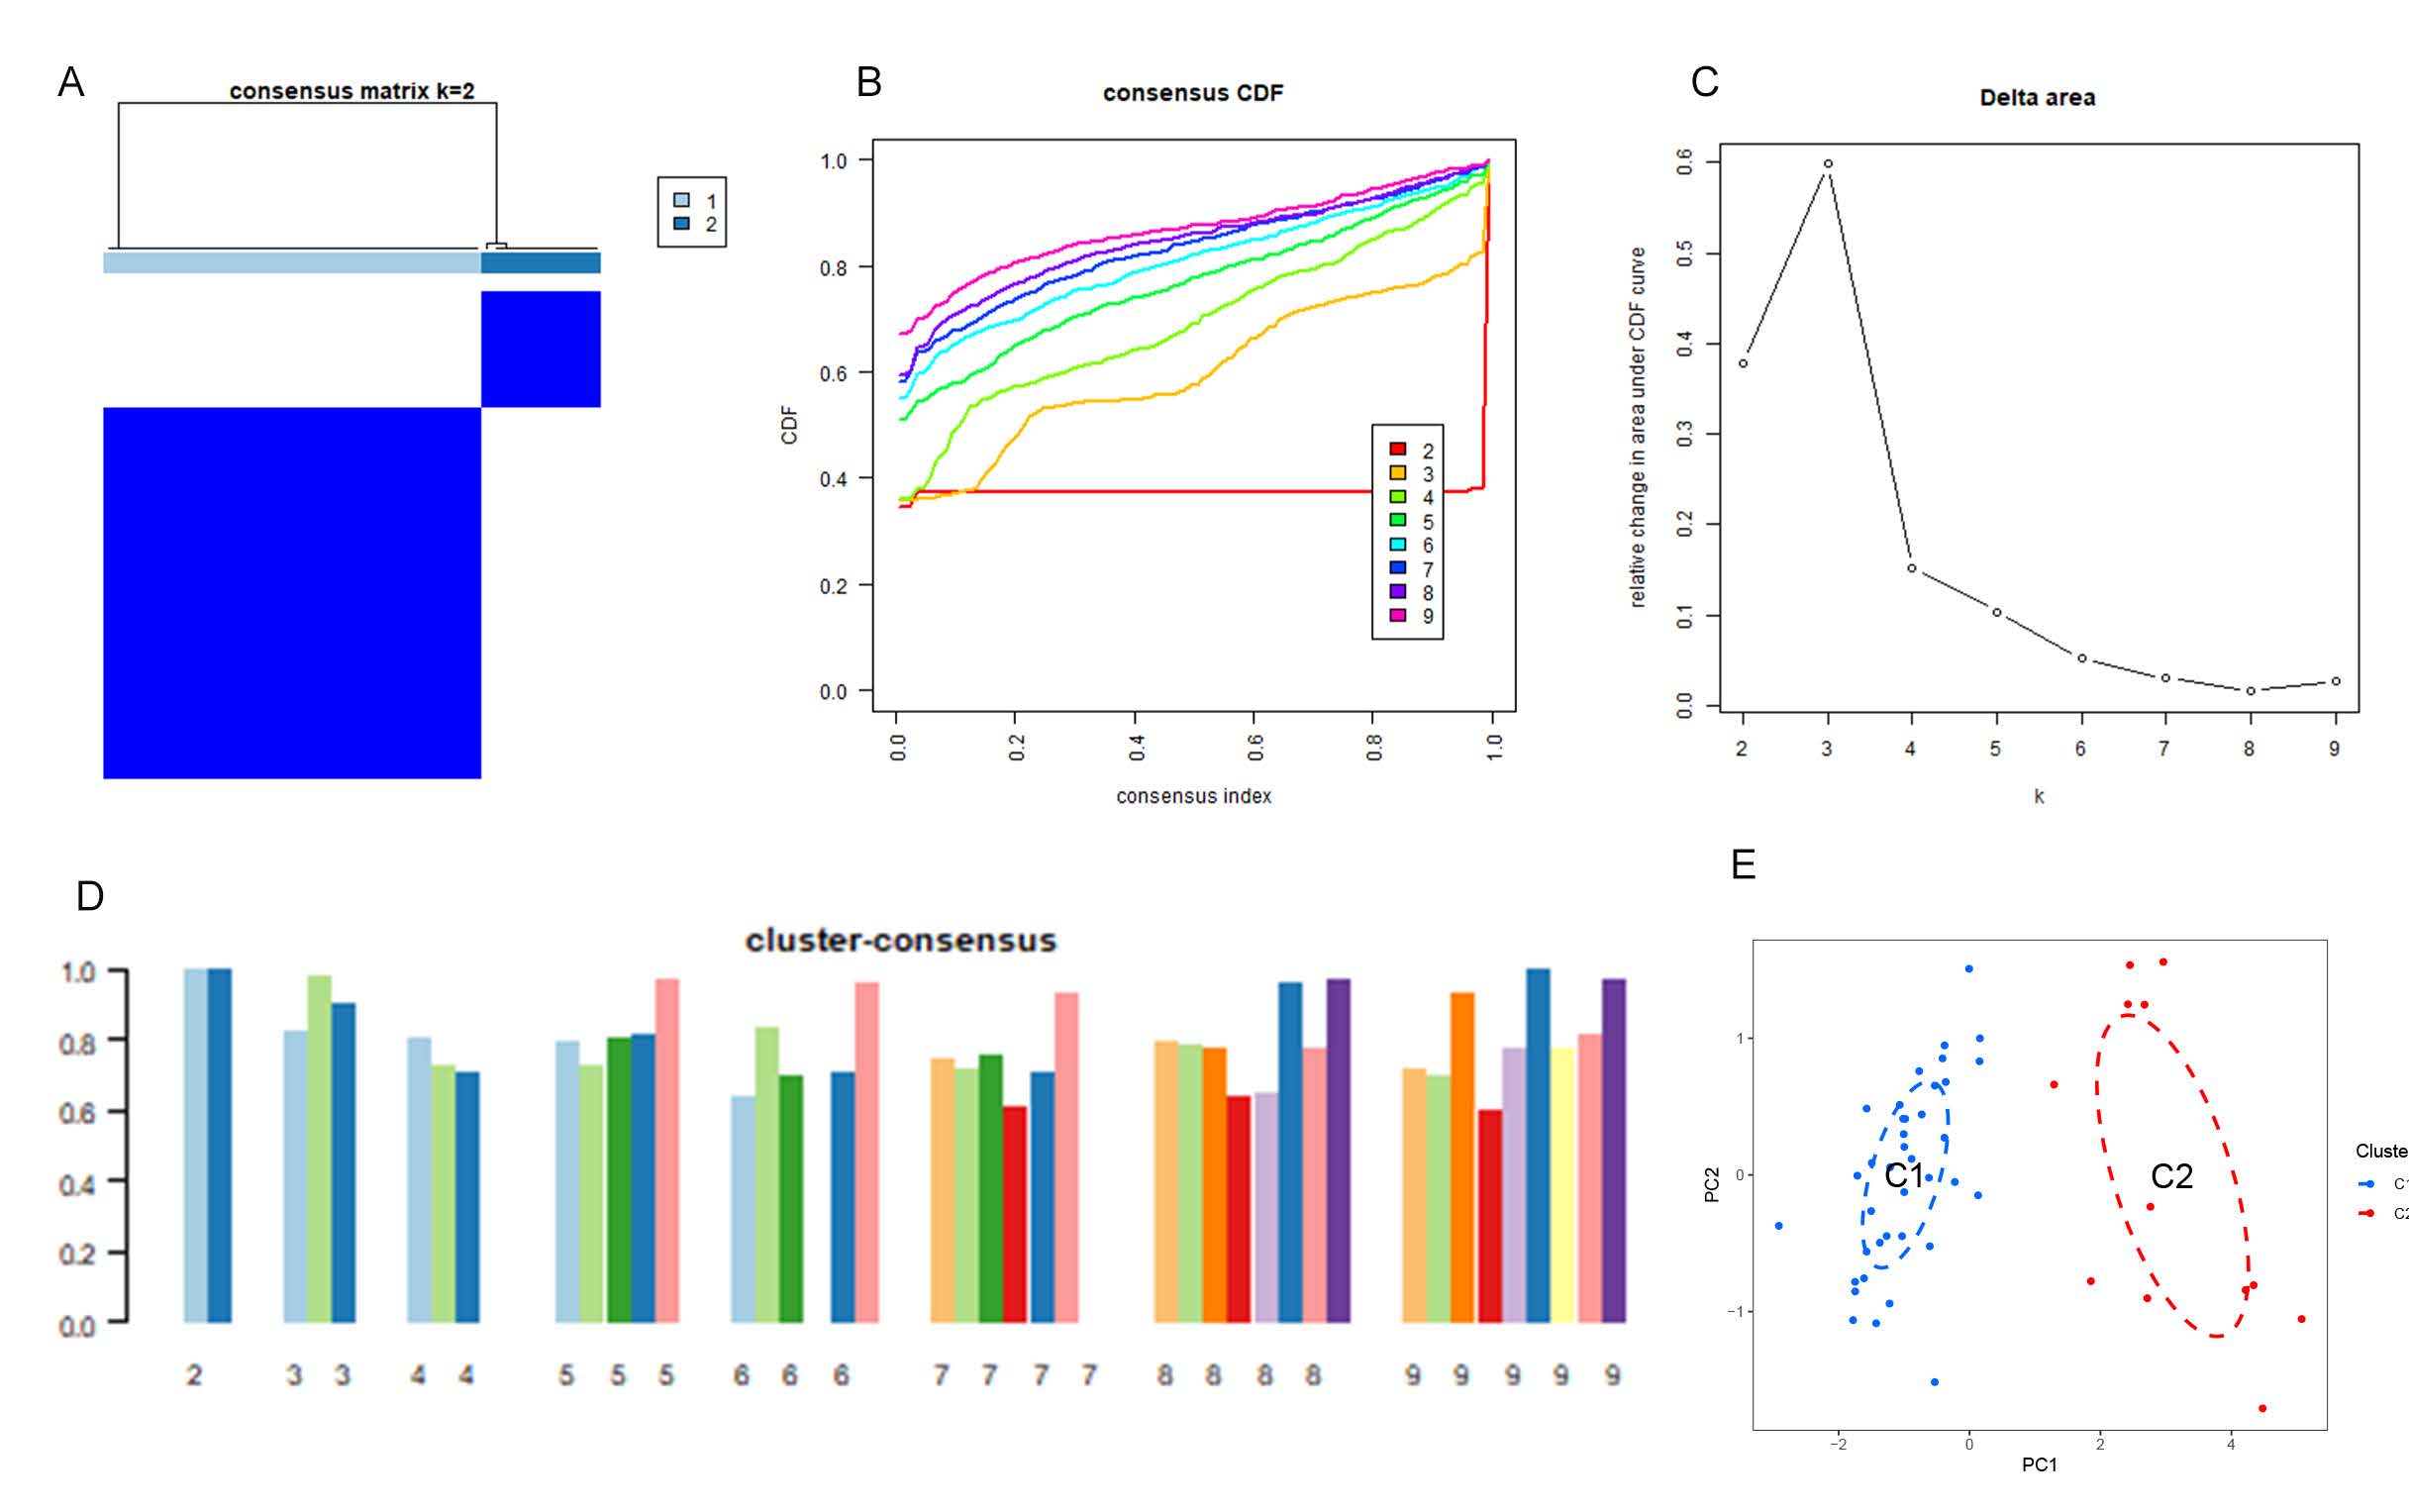
Identification of anoikis clusters in NAFLD
Additionally, 50 NAFLD samples were categorized based on the expression profiles of seven differentially expressed anoikis-related genes (ARGs) using a consensus clustering algorithm. This analysis aimed to identify the expression patterns of genes associated with anoikis in NAFLD. The optimal number of clusters was determined to be two (k=2), where the clustering was most stable (Figure 2A), and the cumulative distribution function (CDF) curve displayed minimal fluctuation within the consensus index range of 0.3 to 0.4 (Figure 2B). When k ranged from 2 to 9, the difference between the areas under the CDF curves (for k and k-1) indicated the optimal clustering at k = 2 (Figure 2C). Furthermore, the concordance scores for each subtype were greater than 0.9 when k=2 (Figure 2D).
Consequently, the 50 NAFLD patients were divided into two distinct groups: Group 1 (n = 38) and Group 2 (n = 12). Principal Component Analysis (PCA) further corroborated the significant differences between the two clusters (Figure 2E). These findings highlight distinct expression patterns of anoikis-related genes in NAFLD, suggesting varied underlying mechanisms and potential therapeutic targets within these patient subgroups.
Figure2. Identification of anoikis-related molecular patterns in NAFLD. (A) Consensus clustering matrix for k = 2, displaying the sample groupings. (B–E) Representative cumulative distribution function (CDF) curves for k values ranging from 2 to 9. (C) Relative changes in CDF delta area curves at different k values. (D) Consensus scores for each subtype across the range of k values (k = 2 to 9). (E) Principal component analysis (PCA) plot revealing the classification of NAFLD patients into two distinct molecular subtypes.
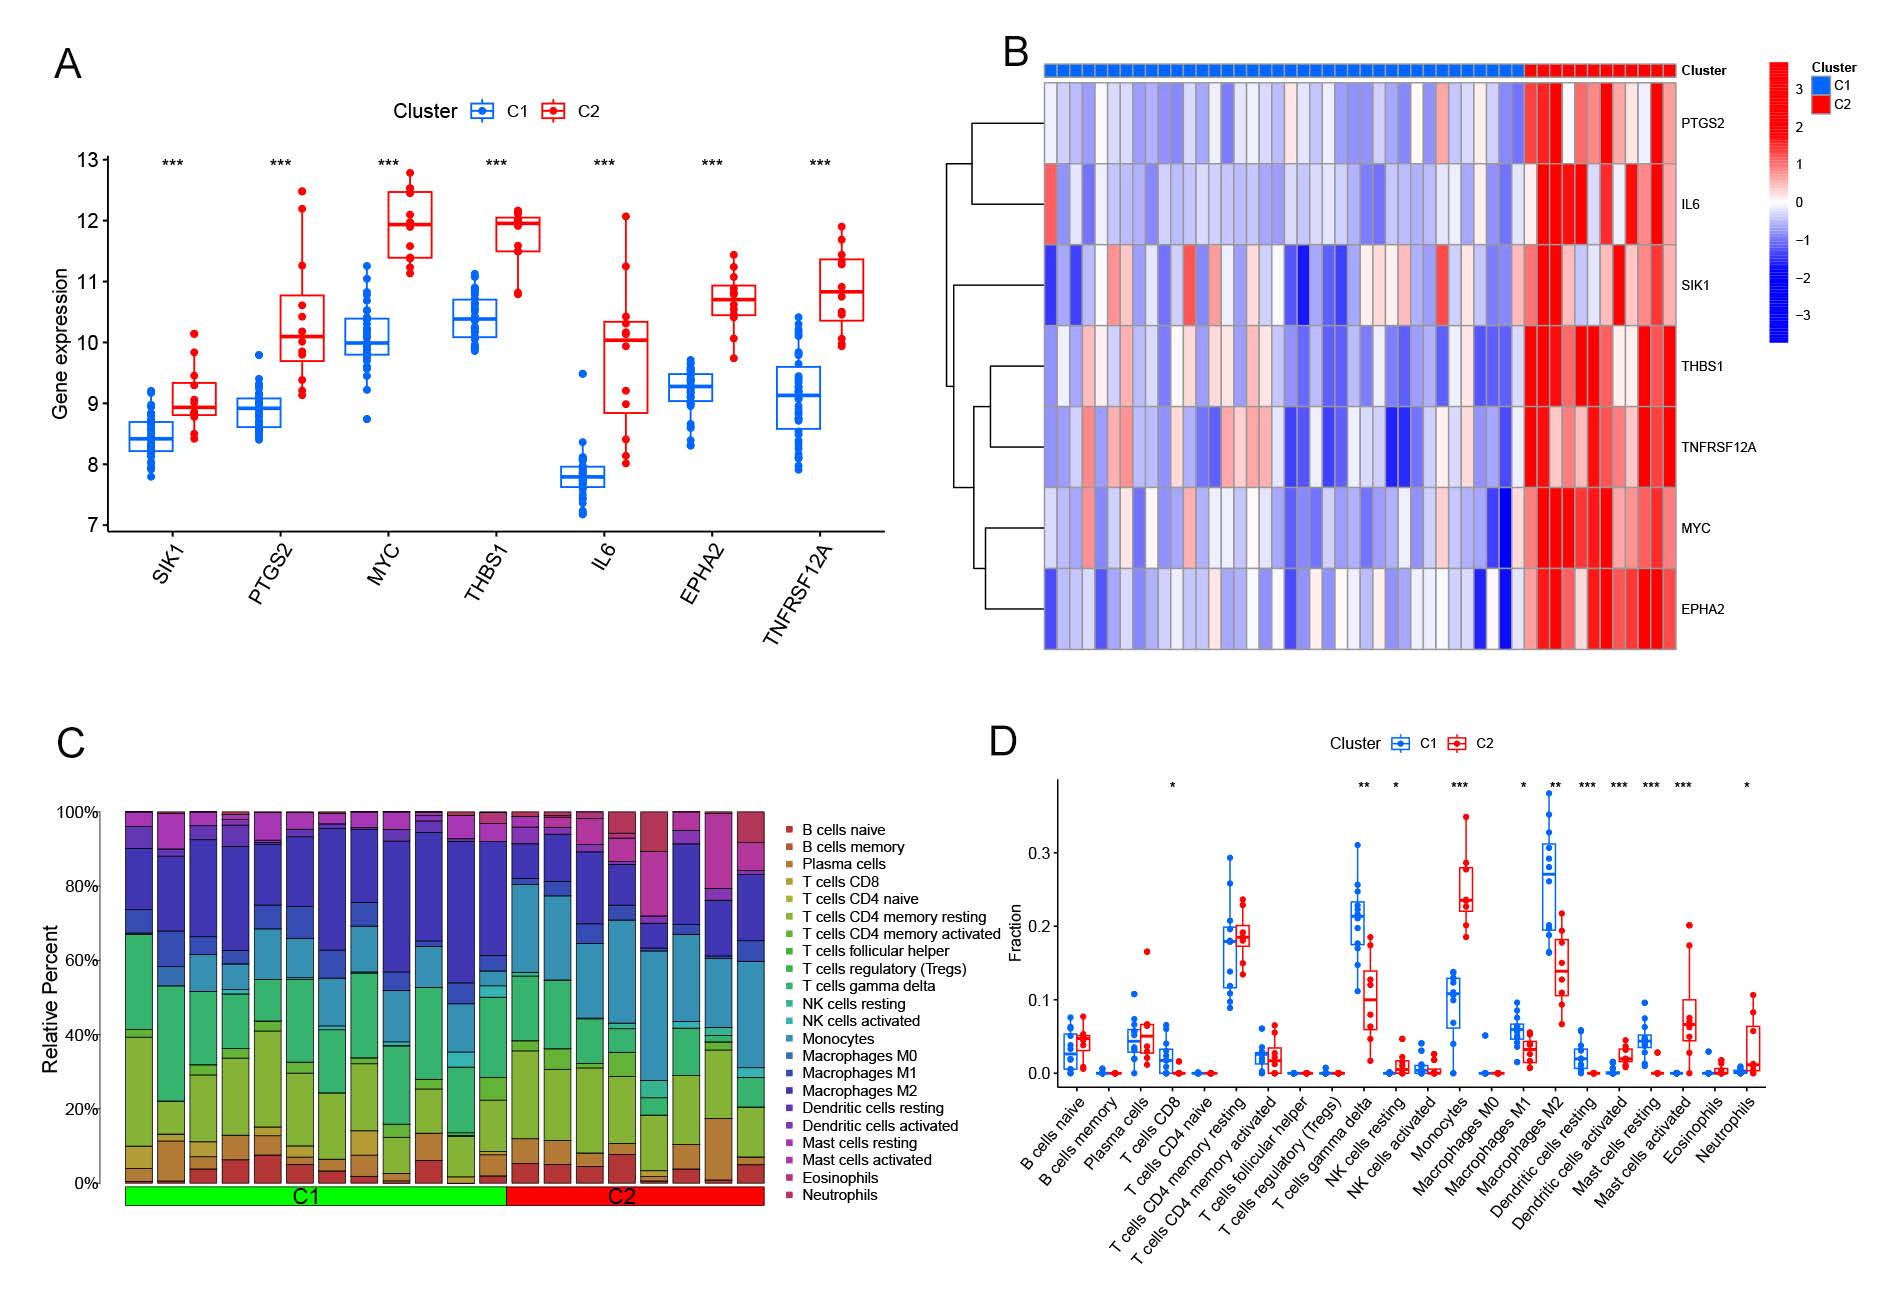
Differential expression of genes regulated by anoikis and immune infiltration signatures of associated anoikis clusters
To further elucidate the molecular characteristics of the identified subgroups, we comprehensively assessed the expression differences of seven critical anoikis-related genes (ARGs) between Cluster 1 and Cluster 2. Notably, Cluster 2 exhibited significantly higher expression levels of these seven CRGs (Figure 3A, B). To provide a detailed immune infiltration analysis, we utilized the CIBERSORT algorithm with LM22 signatures to quantify 22 immune cell types from bulk RNA-seq data. The analysis revealed distinct immune microenvironment profiles between the clusters (Figure 3C, D). Cluster 1 displayed significantly higher proportions of CD8 T cells (p = 0.003), γ-delta T cells (p = 0.002), M1 macrophages (p = 0.005), M2 macrophages (p = 0.004), resting dendritic cells (p = 0.01), and resting mast cells (p = 0.008). In contrast, Cluster 2 was characterized by elevated proportions of monocytes (p = 0.002), activated dendritic cells (p = 0.001), activated mast cells (p = 0.007), and neutrophils (p = 0.003). Furthermore, the immune cell ratio between pro-inflammatory (e.g., M1 macrophages) and anti-inflammatory (e.g., M2 macrophages) populations was higher in Cluster 1, suggesting a more inflammatory phenotype. These findings underscore the divergent immune landscapes between the anoikis-related clusters. Differential immune cell infiltration, particularly the balance between pro- and anti-inflammatory populations, may play a pivotal role in the pathogenesis and progression of NAFLD across these subgroups.
Figure3. Differential analysis of feature gene expression and immune characteristics between anoikis clusters. (A) Boxplots displaying the expression levels of nine feature genes across the two anoikis subtypes, with significance levels indicated (p < 0.05, **p < 0.001, ns, not significant). (B) Heatmap illustrating the differential expression of these nine feature genes between the anoikis subtypes. (C) Relative abundances of 22 infiltrating immune cell types across the two anoikis clusters. (D) Boxplots showing the differences in immune cell infiltration between the anoikis subtypes (p < 0.05, ns, not significant).
Construction of gene weighted co-expression module and gene screening
The Weighted Gene Co-Expression Network Analysis (WGCNA) algorithm was employed to construct co-expression networks and modules in normal controls and individuals with NAFLD, aiming to identify key gene modules associated with NAFLD. Co-expressed gene modules were identified with the soft power value set to 9 and the scale-free R2 set to 0.9 (Figure 4A). The dynamic tree cut algorithm yielded four distinct co-expressed gene modules, each represented by different colors, and a topological overlap matrix (TOM) heat map was generated (Figure 4B–E). Subsequent analysis of the module-clinical signature co-expression, correlating control and NAFLD groups, revealed that the blue module was most closely associated with NAFLD, comprising 566 genes (Figure 4F). This module demonstrated a strong positive correlation with module-associated genes. Further, the WGCNA algorithm was used to analyze key gene modules closely related to anoikis genes. Soft threshold parameters β = 9 and R2 = 0.9 were selected as the most suitable for constructing scale-free networks (S-Figure 3A). Six significant modules were identified, and heatmaps depicting the TOMs of all module-associated genes were generated (S-Figure 3B–E). Analysis of the module-clinical feature relationships between Cluster 1 and Cluster 2 revealed a high correlation between the yellow module (221 genes) and NAFLD clusters (S-Figure 3F). Additionally, correlation analysis indicated that the brown module genes were significantly associated with selected modules
Figure4. Co-expression network of differentially expressed genes in NAFLD. (A) Determination of the optimal soft-thresholding power for network construction. (B) Dendrogram of clustered genes, with distinct co-expression modules represented by different colors. (C) Clustering of module eigengenes. (D) Heatmap showing the correlations among the five identified modules. (E) Correlation analysis between module eigengenes and clinical status, with rows indicating modules and columns representing clinical traits. (F) Scatter plot depicting the relationship between module membership in the blue module and gene significance for NAFLD.
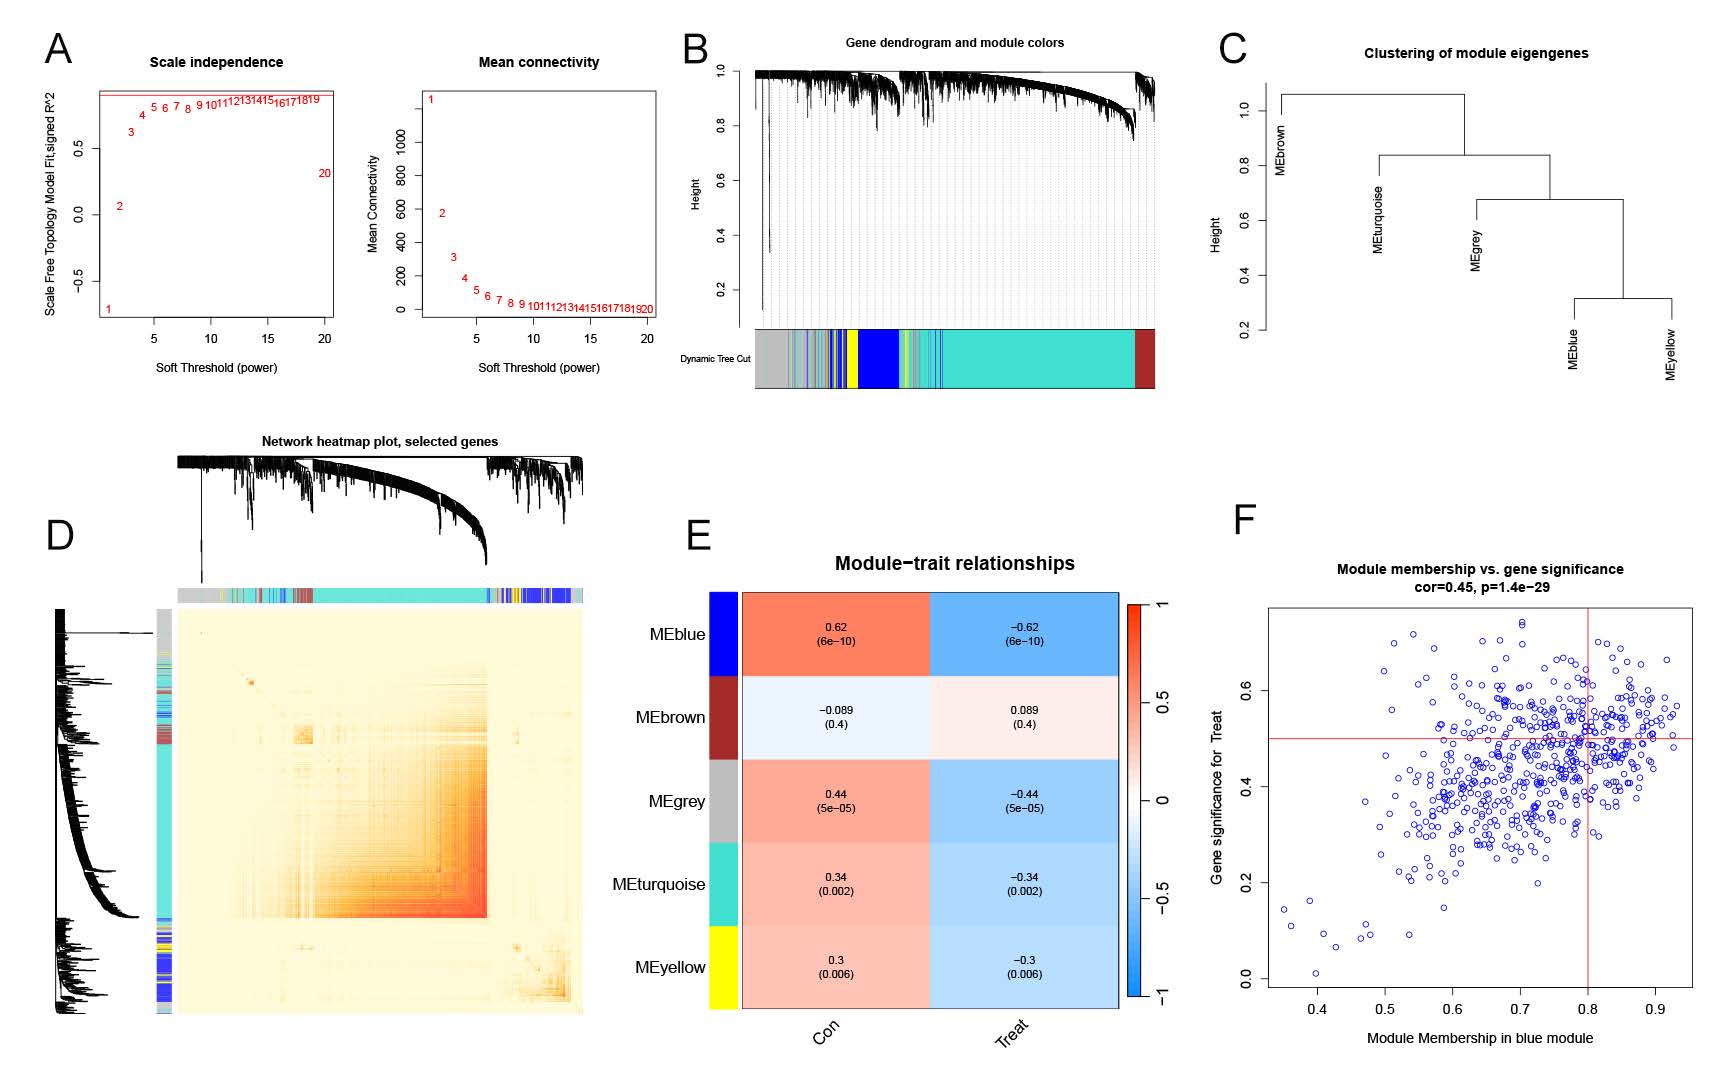
These findings highlight the importance of the blue and yellow modules in NAFLD and their potential involvement in the disease's molecular mechanisms, providing valuable insights for future research into NAFLD pathogenesis and therapeutic targets.
Identification of cluster-specific DEGs and functional annotation
A total of 161 cluster-specific differentially expressed genes (DEGs) were identified by intersecting module-associated genes of anoikis with those from NAFLD and non-NAFLD individuals (S-Figure 4A). To elucidate the functional differences between the clusters, Gene Set Variation Analysis (GSVA) was performed on these cluster-specific DEGs. GSVA scores were calculated using a Kolmogorov-Smirnov-like rank-based method to determine pathway enrichment levels across clusters. The analysis revealed that Cluster 2 exhibited upregulation in pathways related to sulfur metabolism, steroid hormone biosynthesis, and bile acid biosynthesis, while Cluster 1 showed increased expression in glycosaminoglycan biosynthesis, chondroitin sulfate metabolism, ECM-receptor interactions, and the ERBB signaling pathway (S-Figure 4C). Furthermore, Biological Process analysis was performed using the over-representation analysis (ORA) method, applying a hypergeometric test with a significance threshold of adjusted p-value < 0.05 (S-Figure 4B). These findings underscore distinct functional pathways associated with each cluster, providing insights into the molecular mechanisms underlying NAFLD and its potential therapeutic targets.
Machine learning model construction and evaluation
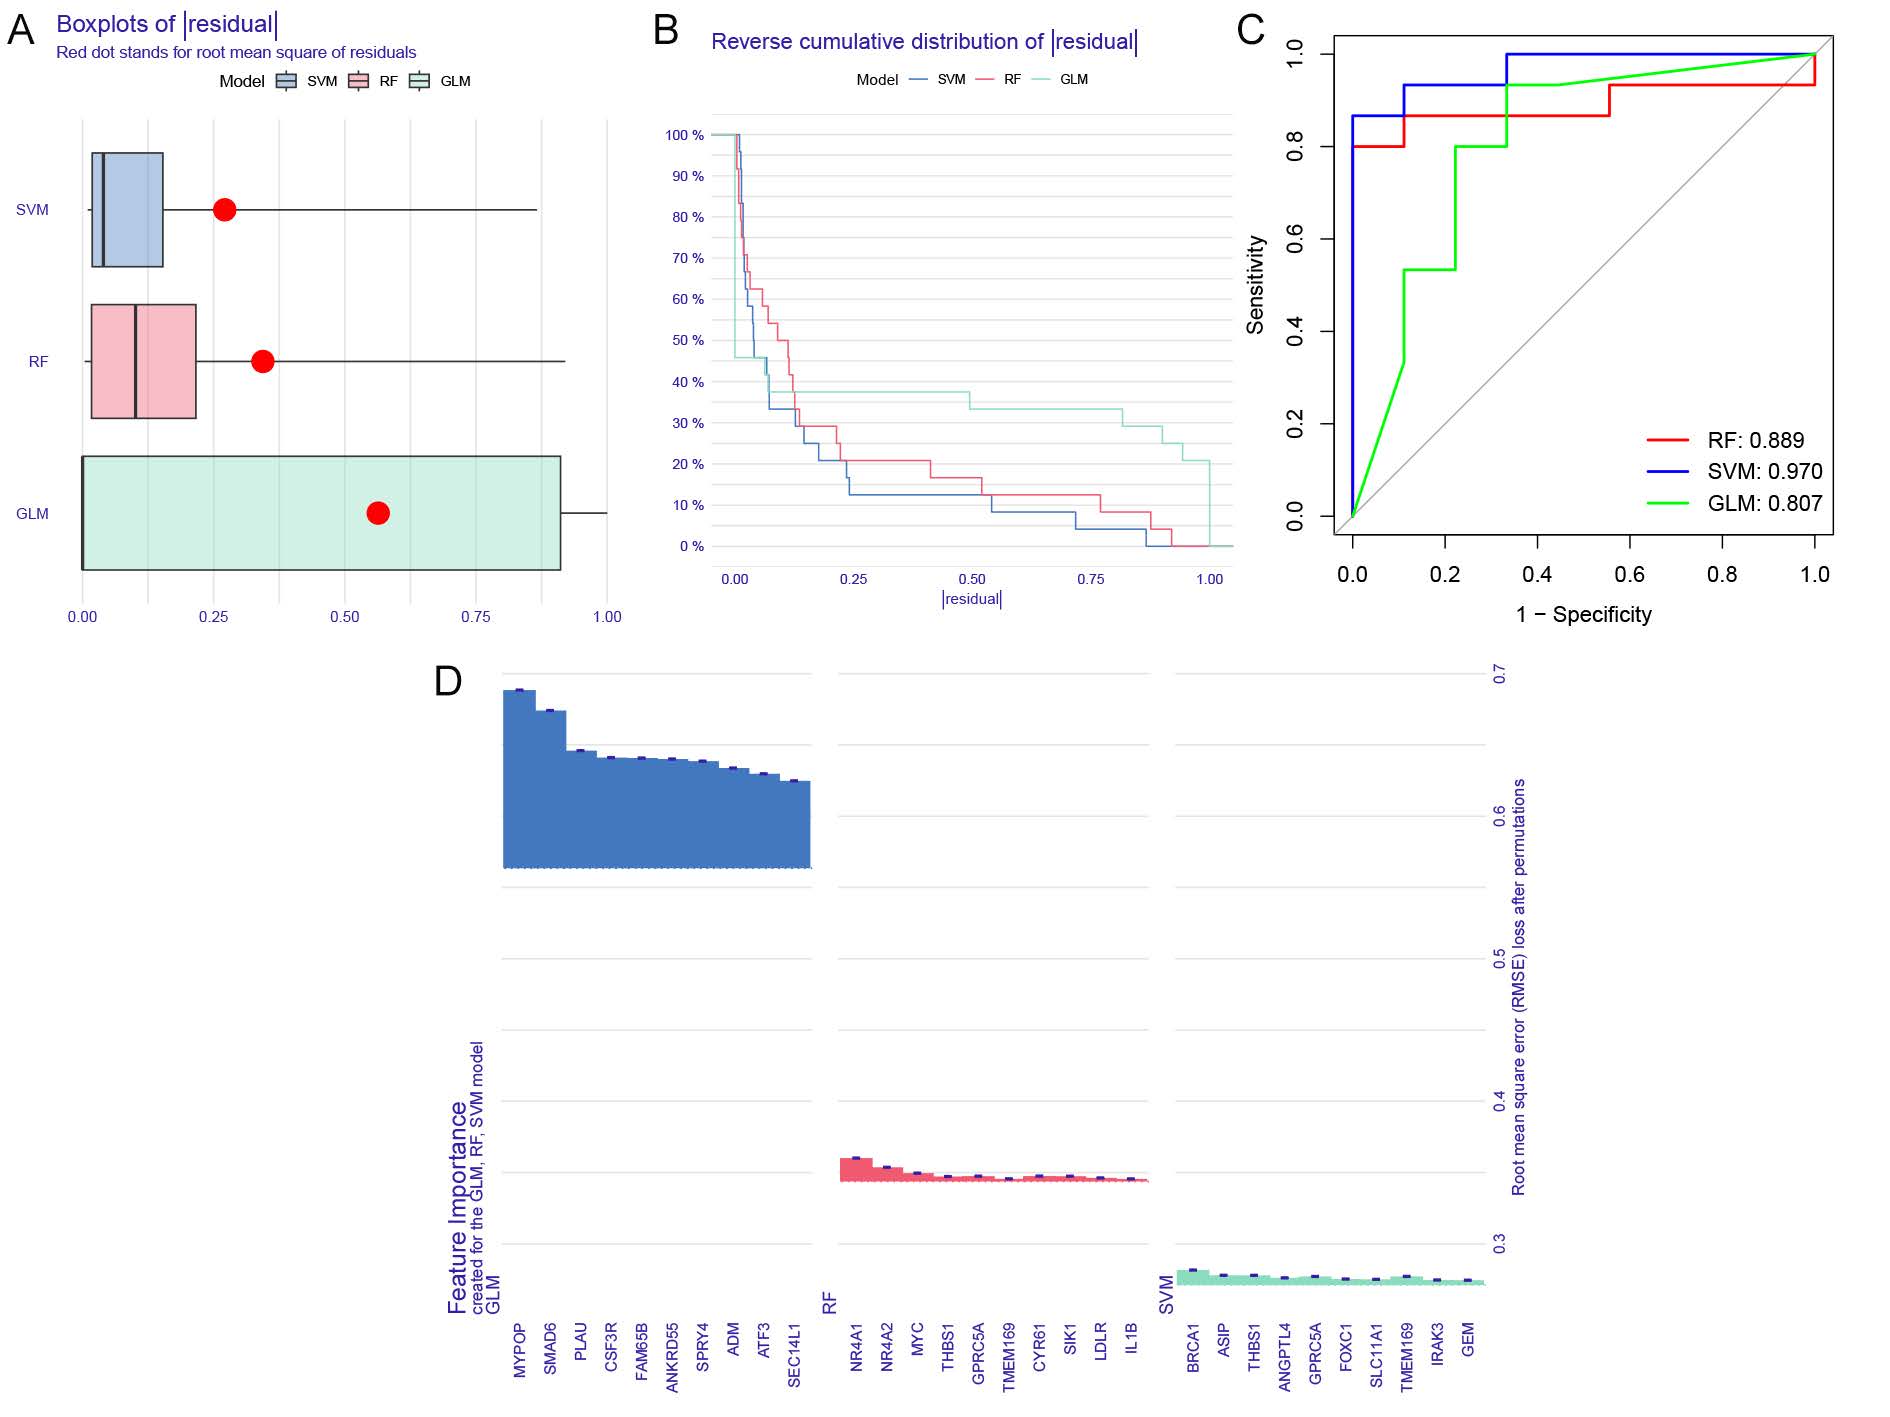
A total of 161 module-related genes, intersected from individuals with and without NAFLD based on anoikis-associated gene subsets, were analyzed to identify cluster-specific genes with high diagnostic potential. Three established machine learning models—Random Forest (RF), Support Vector Machine (SVM), and Generalized Linear Model (GLM)—were developed to evaluate these genes. Model performance was interpreted using the R package ‘Dalex,’ and residual distributions for each model in the test set were plotted. The GLM and RF models exhibited relatively low residuals (Figure 5A-B). The top 10 significant feature variables for each model were ranked based on root mean square error (RMSE) (Figure 5D).
The discriminative performance of the models was assessed through receiver operating characteristic (ROC) curve analysis with fivefold cross-validation. The SVM model demonstrated the highest area under the ROC curve (AUC=0.97, Figure 5C), indicating superior performance in distinguishing between clusters. Consequently, the four most significant variables (TMEM169, THBS1, ASIP, BRCA1) from the SVM model were selected for further analysis.
Figure5. Construction and evaluation of RF, SVM, and GLM machine learning models. (A) Boxplots displaying the residuals for each machine learning model, with the red dot indicating the root mean square error (RMSE). (B) Cumulative residual distribution across the models. (C) ROC analysis of the three machine learning models, assessed via 5-fold cross-validation in the testing cohort. (D) Key features identified in the RF, SVM, and GLM models.
Validation in dataset GSE126848, which includes 31 NAFLD patients and 26 normal controls, confirmed the expression differences of these signature genes. Specifically, THBS1 and ASIP were downregulated in NAFLD, while TMEM169 and BRCA1 were upregulated (S-Figure 5A, B). ROC analysis in this validation set demonstrated effective diagnostic performance for NAFLD (AUC = 0.778, S-Figure 5C). A nomogram was constructed to predict NAFLD progression, incorporating point values for each characteristic variable. The nomogram’s standard curve validated its capacity to accurately assess NAFLD progression (S-Figure 2A, B). Decision curve analysis further indicated that the nomogram offers clinical benefit for NAFLD patients (Figure 8C). Collectively, these findings suggest that this subset of anoikis-associated genes can effectively differentiate NAFLD from non-NAFLD cases.
In vitro experiments further verified the results
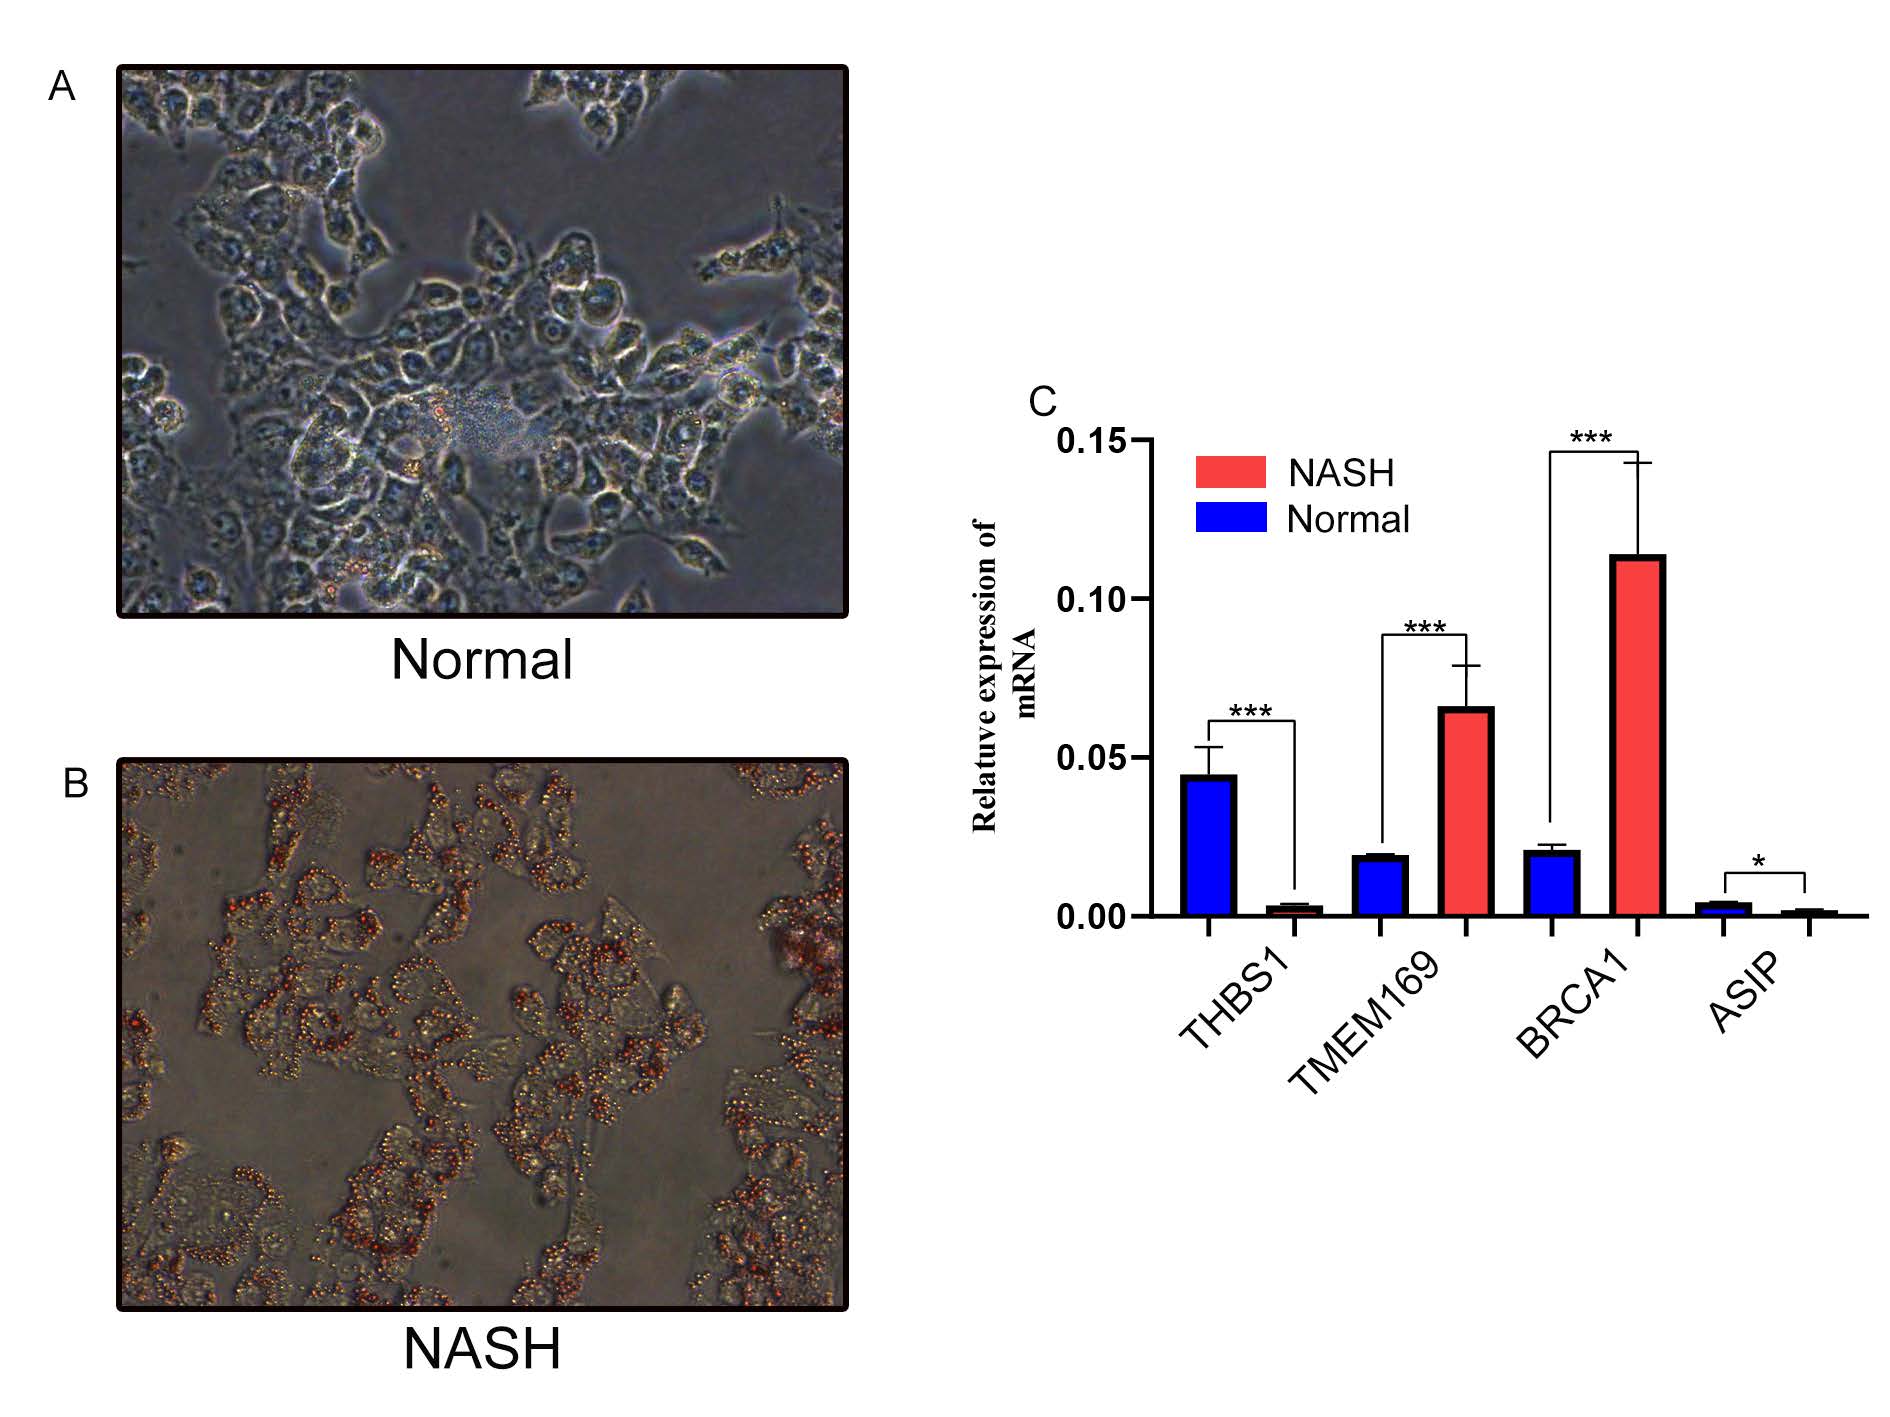
In vitro studies were conducted using AML12 cells. AML12 cells were treated with oleate (OA) and palmitate (PA) to induce fat accumulation, mimicking hepatic steatosis. Following free fatty acid (FFA) induction, cells exhibited increased fat accumulation (Figure 6A–B). Expression of TMEM169 and BRCA1 was elevated, while ASIP and THBS1 expression decreased (Figure 6C).
Figure6. Verification of model gene mRNA expression levels in AML12 cells. β-Actin served as the control. (A-B) Oil Red O staining of the cells, with magnification at ×100. (C) Relative mRNA levels of TMEM169, THBS1, ASIP, and BRCA1, normalized to β-Actin. Data are presented as mean ± s.d. p < 0.05; *p < 0.01; **p < 0.001.
Discussion
NAFLD is the most prevalent chronic liver disease, with its incidence steadily increasing over the past two decades due to lifestyle and dietary changes. While apoptosis and pyroptosis have been studied extensively, the role of anoikis in NAFLD remains unclear. Our findings highlight seven anoikis-related genes (SIK1, MYC, IL6, TNFRSF12A, PTGS2, THBS1, EPHA2) as critical regulators of NAFLD pathogenesis. These genes were significantly upregulated in NAFLD patients compared to healthy controls, with THBS1 and TNFRSF12A showing a strong synergistic correlation. This aligns with prior research emphasizing the pivotal roles of macrophages in NAFLD progression [15,16] . The polarization of macrophages into pro-inflammatory (M1) and anti-inflammatory (M2) phenotypes plays a dual role in promoting inflammation and facilitating tissue repair, respectively. Additionally, our study demonstrated that Cluster 2, characterized by high expression of ARGs, exhibited enhanced immune activation, as evidenced by elevated monocyte and neutrophil levels. Pathway enrichment revealed that Cluster 2 was predominantly associated with sulfur metabolism, steroid hormone biosynthesis, and bile acid biosynthesis, consistent with previous studies linking these pathways to immune activation and inflammation in NAFLD [19,20] . By integrating immune infiltration data with ARG expression, we provide a comprehensive understanding of how anoikis impacts NAFLD progression.
The machine learning-based SVM model achieved the highest predictive accuracy (AUC = 0.970), identifying TMEM169, THBS1, ASIP, and BRCA1 as key diagnostic markers. This model was validated using external datasets, ensuring its generalizability. THBS1, a critical mediator of hepatocyte homeostasis, and BRCA1, associated with multiple cancer types including hepatocellular carcinoma, were notably overexpressed in HCC, corroborating our findings. However, the practical implementation of this model poses challenges, including the need for large-scale validation in diverse populations and integration with clinical workflows. Additionally, population heterogeneity, such as ethnic and regional differences in NAFLD prevalence, may influence the generalizability of our findings. The inclusion of a nomogram further enhances clinical applicability, offering a user-friendly tool for NAFLD risk assessment. Despite these advancements, limitations such as a relatively small sample size and the lack of longitudinal clinical data warrant further investigation. Future studies should explore the dynamic interplay between ARGs and the immune microenvironment in larger cohorts.
Conclusion
This study establishes the critical role of anoikis in the progression and immune cell infiltration of non-alcoholic fatty liver disease (NAFLD). By identifying and validating two distinct anoikis-related molecular clusters and four key genes (TMEM169, THBS1, ASIP, and BRCA1), the research supports a predictive model with high accuracy.
Supplementary Material
Supplementary methods, results, spectra, figures.
Acknowledgements
Not applicable.
Author contributions
Jinzhen Cai, Yuming Wang contributed to the research design. Jinzhen Cai, Yuming Wang, Xinqiang Li, Jijun Shan and Ruidong Ding contributed to the data management and statistical analyses. Jinzhen Cai, Yuming Wang wrote the manuscript. All authors reviewed the manuscript.
Funding information
This work was supported by the National Natural Science Foundation of China (No. 82370666) and the Science Foundation of Shandong Province (No. ZR2022MH292).
Competing Interests
The authors declare that they have no existing or potential commercial or financial relationships that could create a conflict of interest at the time of conducting this study.
Data Availability
All data needed to evaluate the conclusions in the paper are present in the paper or the Supplementary Materials. Additional data related to this paper may be requested from the authors.
References
[1] Guo X, Yin X, Liu Z, Wang J. Non-Alcoholic Fatty Liver Disease (NAFLD) Pathogenesis and Natural Products for Prevention and Treatment. Int J Mol Sci. 2022; https://doi.org/10.3390/ijms232415489
[2] Younossi Z. Global burden of NAFLD and NASH: trends, predictions, risk factors and prevention; https://doi.org/10.1038/nrgastro.2017.109
[3] Younossi ZM, Koenig AB, Abdelatif D, Fazel Y, Henry L, Wymer M. Global epidemiology of nonalcoholic fatty liver disease-Meta-analytic assessment of prevalence, incidence, and outcomes. Hepatol Baltim Md. 2016;64:73–84; https://doi.org/10.1002/hep.28431
[4] Byrne CD, Targher G. NAFLD: a multisystem disease. J Hepatol. 2015;62:S47-64; https://doi.org/10.1016/j.jhep.2014.12.012
[5] Li Y, Pan Q, Cheng M, Wu Z. Identification and validation of anoikis-associated gene SNCG as a prognostic biomarker in gastric cancer. Aging. 2023;15:2541–53; https://doi.org/10.1016/j.jhep.2014.12.012
[6] Ni K, Meng L. Mechanism of PANoptosis in metabolic dysfunction-associated steatotic liver disease. Clin Res Hepatol Gastroenterol. 2024;48:102381; DOI:10.1016/j.clinre.2024.102381
[7] Sun H-J, Jiao B, Wang Y, Zhang Y-H, Chen G, Wang Z-X, et al. Necroptosis contributes to non-alcoholic fatty liver disease pathoetiology with promising diagnostic and therapeutic functions. World J Gastroenterol. 2024;30:1968–81; https://doi.org/10.3748/wjg.v30.i14.1968
[8] Li R, Xue W, Wei H, Fan Q, Li X, Qiu Y, et al. Research Progress of Pyroptosis in Fatty Liver Disease. Int J Mol Sci. 2023;24:13065.
[9] Langfelder P, Horvath S. WGCNA: an R package for weighted correlation network analysis. BMC Bioinformatics. 2008;9:559; https://doi.org/10.3390/ijms241713065
[10] Rigatti SJ. Random Forest. J Insur Med N Y N. 2017;47:31–9; https://doi.org/10.17849/insm-47-01-31-39.1
[11] Tan M, Pu J, Zheng B. Optimization of breast mass classification using sequential forward floating selection (SFFS) and a support vector machine (SVM) model. Int J Comput Assist Radiol Surg. 2014;9:1005–20; https://doi.org/10.1007/s11548-014-0992-1
[12] Weng G, Clark K, Akbarian A, Noudoost B, Nategh N. Time-varying generalized linear models: characterizing and decoding neuronal dynamics in higher visual areas. Front Comput Neurosci. 2024;18:1273053; https://doi.org/10.3389/fncom.2024.1273053
[13] Chu MJJ, Hickey AJR, Tagaloa S, Zhang L, Dare AJ, MacDonald JR, et al. Ob/ob mouse livers show decreased oxidative phosphorylation efficiencies and anaerobic capacities after cold ischemia. PloS One. 2014;9:e100609; https://doi.org/10.1371/journal.pone.0100609
[14] Roychowdhury S, McCullough RL, Sanz-Garcia C, Saikia P, Alkhouri N, Matloob A, et al. Receptor interacting protein 3 protects mice from high-fat diet-induced liver injury. Hepatol Baltim Md. 2016;64:1518–33; https://doi.org/10.1002/hep.28676
[15] Kazankov K, Jørgensen SMD, Thomsen KL, Møller HJ, Vilstrup H, George J, et al. The role of macrophages in nonalcoholic fatty liver disease and nonalcoholic steatohepatitis. Nat Rev Gastroenterol Hepatol. 2019;16:145–59; https://doi.org/10.1038/s41575-018-0082-x
[16] Wang Y, Smith W, Hao D, He B, Kong L. M1 and M2 macrophage polarization and potentially therapeutic naturally occurring compounds. Int Immunopharmacol. 2019;70:459–66; https://doi.org/10.1016/j.intimp.2019.02.050
[17] Gong H, He Q, Zhu L, Feng Z, Sun M, Jiang J, et al. Associations between systemic inflammation indicators and nonalcoholic fatty liver disease: evidence from a prospective study. Front Immunol. 2024;15:1389967. https://doi.org/10.3389/fimmu.2024.1389967
[18] Wang Y-F, Zhang W-L, Li Z-X, Liu Y, Tan J, Yin H-Z, et al. METTL14 downregulation drives S100A4+ monocyte-derived macrophages via MyD88/NF-κB pathway to promote MAFLD progression. Signal Transduct Target Ther. 2024;9:91; https://doi.org/10.1038/s41392-024-01797-1
[19] Liu Z, Huang H, Ruan J, Wang Z, Xu C. The sulfur microbial diet and risk of nonalcoholic fatty liver disease: a prospective gene-diet study from the UK Biobank. Am J Clin Nutr. 2024;119:417–24; https://doi.org/10.1016/j.ajcnut.2023.11.012
[20] Bin D-H, Liu F, Peng K-P, Zhan M, Tan Y, Liu Q, et al. The relationship between follicle-stimulating hormone and metabolic dysfunction-associated fatty liver disease in men. Nutr Diabetes. 2024;14:52; https://doi.org/10.1038/s41387-024-00314-1
[21] Deo RC. Machine Learning in Medicine. Circulation. 2015;132:1920–30. https://doi.org/10.1161/CIRCULATIONAHA.115.001593
[22] Bai J, Xia M, Xue Y, Ma F, Cui A, Sun Y, et al. Thrombospondin 1 improves hepatic steatosis in diet-induced insulin-resistant mice and is associated with hepatic fat content in humans. EBioMedicine. 2020;57:102849; https://doi.org/10.1016/j.ebiom.2020.102849
[23] Mei J, Wang R, Xia D, Yang X, Zhou W, Wang H, et al. BRCA1 Is a Novel Prognostic Indicator and Associates with Immune Cell Infiltration in Hepatocellular Carcinoma. DNA Cell Biol. 2020;39:1838–49. https://doi.org/10.1089/dna.2020.5644
 Figures
 References
 Peer
Peer Information
Figure1. Expression of ARGs in NAFLD. (A) Boxplots illustrating the differential expression of seven ARGs between NAFLD patients and non-NAFLD controls, with significance levels denoted as p < 0.05, *p < 0.01, **p < 0.001, and ns indicating no significance. (B) Heatmap showing the expression patterns of the seven ARGs (C) Correlation analysis of nine differentially expressed CRGs. (D) Gene interaction network of the seven differentially expressed ARGs. (E) Comparative analysis of the relative abundance of 22 infiltrating immune cell types between NAFLD and non-NAFLD controls. (F) Boxplots representing differences in immune cell infiltration between NAFLD and non-NAFLD cohorts, with significance levels as p < 0.05, *p < 0.01, **p < 0.001, and ns indicating no significance. (G) Correlation analysis between the expression of seven differentially expressed ARGs and infiltrating immune cells.
Figure2. Identification of anoikis-related molecular patterns in NAFLD. (A) Consensus clustering matrix for k = 2, displaying the sample groupings. (B–E) Representative cumulative distribution function (CDF) curves for k values ranging from 2 to 9. (C) Relative changes in CDF delta area curves at different k values. (D) Consensus scores for each subtype across the range of k values (k = 2 to 9). (E) Principal component analysis (PCA) plot revealing the classification of NAFLD patients into two distinct molecular subtypes.
Figure3. Differential analysis of feature gene expression and immune characteristics between anoikis clusters. (A) Boxplots displaying the expression levels of nine feature genes across the two anoikis subtypes, with significance levels indicated (p < 0.05, **p < 0.001, ns, not significant). (B) Heatmap illustrating the differential expression of these nine feature genes between the anoikis subtypes. (C) Relative abundances of 22 infiltrating immune cell types across the two anoikis clusters. (D) Boxplots showing the differences in immune cell infiltration between the anoikis subtypes (p < 0.05, ns, not significant).
Figure4. Co-expression network of differentially expressed genes in NAFLD. (A) Determination of the optimal soft-thresholding power for network construction. (B) Dendrogram of clustered genes, with distinct co-expression modules represented by different colors. (C) Clustering of module eigengenes. (D) Heatmap showing the correlations among the five identified modules. (E) Correlation analysis between module eigengenes and clinical status, with rows indicating modules and columns representing clinical traits. (F) Scatter plot depicting the relationship between module membership in the blue module and gene significance for NAFLD.
Figure5. Construction and evaluation of RF, SVM, and GLM machine learning models. (A) Boxplots displaying the residuals for each machine learning model, with the red dot indicating the root mean square error (RMSE). (B) Cumulative residual distribution across the models. (C) ROC analysis of the three machine learning models, assessed via 5-fold cross-validation in the testing cohort. (D) Key features identified in the RF, SVM, and GLM models.
Figure6. Verification of model gene mRNA expression levels in AML12 cells. β-Actin served as the control. (A-B) Oil Red O staining of the cells, with magnification at ×100. (C) Relative mRNA levels of TMEM169, THBS1, ASIP, and BRCA1, normalized to β-Actin. Data are presented as mean ± s.d. p < 0.05; *p < 0.01; **p < 0.001.
[1] Guo X, Yin X, Liu Z, Wang J. Non-Alcoholic Fatty Liver Disease (NAFLD) Pathogenesis and Natural Products for Prevention and Treatment. Int J Mol Sci. 2022; https://doi.org/10.3390/ijms232415489
[2] Younossi Z. Global burden of NAFLD and NASH: trends, predictions, risk factors and prevention; https://doi.org/10.1038/nrgastro.2017.109
[3] Younossi ZM, Koenig AB, Abdelatif D, Fazel Y, Henry L, Wymer M. Global epidemiology of nonalcoholic fatty liver disease-Meta-analytic assessment of prevalence, incidence, and outcomes. Hepatol Baltim Md. 2016;64:73–84; https://doi.org/10.1002/hep.28431
[4] Byrne CD, Targher G. NAFLD: a multisystem disease. J Hepatol. 2015;62:S47-64; https://doi.org/10.1016/j.jhep.2014.12.012
[5] Li Y, Pan Q, Cheng M, Wu Z. Identification and validation of anoikis-associated gene SNCG as a prognostic biomarker in gastric cancer. Aging. 2023;15:2541–53; https://doi.org/10.1016/j.jhep.2014.12.012
[6] Ni K, Meng L. Mechanism of PANoptosis in metabolic dysfunction-associated steatotic liver disease. Clin Res Hepatol Gastroenterol. 2024;48:102381; DOI:10.1016/j.clinre.2024.102381
[7] Sun H-J, Jiao B, Wang Y, Zhang Y-H, Chen G, Wang Z-X, et al. Necroptosis contributes to non-alcoholic fatty liver disease pathoetiology with promising diagnostic and therapeutic functions. World J Gastroenterol. 2024;30:1968–81; https://doi.org/10.3748/wjg.v30.i14.1968
[8] Li R, Xue W, Wei H, Fan Q, Li X, Qiu Y, et al. Research Progress of Pyroptosis in Fatty Liver Disease. Int J Mol Sci. 2023;24:13065.
[9] Langfelder P, Horvath S. WGCNA: an R package for weighted correlation network analysis. BMC Bioinformatics. 2008;9:559; https://doi.org/10.3390/ijms241713065
[10] Rigatti SJ. Random Forest. J Insur Med N Y N. 2017;47:31–9; https://doi.org/10.17849/insm-47-01-31-39.1
[11] Tan M, Pu J, Zheng B. Optimization of breast mass classification using sequential forward floating selection (SFFS) and a support vector machine (SVM) model. Int J Comput Assist Radiol Surg. 2014;9:1005–20; https://doi.org/10.1007/s11548-014-0992-1
[12] Weng G, Clark K, Akbarian A, Noudoost B, Nategh N. Time-varying generalized linear models: characterizing and decoding neuronal dynamics in higher visual areas. Front Comput Neurosci. 2024;18:1273053; https://doi.org/10.3389/fncom.2024.1273053
[13] Chu MJJ, Hickey AJR, Tagaloa S, Zhang L, Dare AJ, MacDonald JR, et al. Ob/ob mouse livers show decreased oxidative phosphorylation efficiencies and anaerobic capacities after cold ischemia. PloS One. 2014;9:e100609; https://doi.org/10.1371/journal.pone.0100609
[14] Roychowdhury S, McCullough RL, Sanz-Garcia C, Saikia P, Alkhouri N, Matloob A, et al. Receptor interacting protein 3 protects mice from high-fat diet-induced liver injury. Hepatol Baltim Md. 2016;64:1518–33; https://doi.org/10.1002/hep.28676
[15] Kazankov K, Jørgensen SMD, Thomsen KL, Møller HJ, Vilstrup H, George J, et al. The role of macrophages in nonalcoholic fatty liver disease and nonalcoholic steatohepatitis. Nat Rev Gastroenterol Hepatol. 2019;16:145–59; https://doi.org/10.1038/s41575-018-0082-x
[16] Wang Y, Smith W, Hao D, He B, Kong L. M1 and M2 macrophage polarization and potentially therapeutic naturally occurring compounds. Int Immunopharmacol. 2019;70:459–66; https://doi.org/10.1016/j.intimp.2019.02.050
[17] Gong H, He Q, Zhu L, Feng Z, Sun M, Jiang J, et al. Associations between systemic inflammation indicators and nonalcoholic fatty liver disease: evidence from a prospective study. Front Immunol. 2024;15:1389967. https://doi.org/10.3389/fimmu.2024.1389967
[18] Wang Y-F, Zhang W-L, Li Z-X, Liu Y, Tan J, Yin H-Z, et al. METTL14 downregulation drives S100A4+ monocyte-derived macrophages via MyD88/NF-κB pathway to promote MAFLD progression. Signal Transduct Target Ther. 2024;9:91; https://doi.org/10.1038/s41392-024-01797-1
[19] Liu Z, Huang H, Ruan J, Wang Z, Xu C. The sulfur microbial diet and risk of nonalcoholic fatty liver disease: a prospective gene-diet study from the UK Biobank. Am J Clin Nutr. 2024;119:417–24; https://doi.org/10.1016/j.ajcnut.2023.11.012
[20] Bin D-H, Liu F, Peng K-P, Zhan M, Tan Y, Liu Q, et al. The relationship between follicle-stimulating hormone and metabolic dysfunction-associated fatty liver disease in men. Nutr Diabetes. 2024;14:52; https://doi.org/10.1038/s41387-024-00314-1
[21] Deo RC. Machine Learning in Medicine. Circulation. 2015;132:1920–30. https://doi.org/10.1161/CIRCULATIONAHA.115.001593
[22] Bai J, Xia M, Xue Y, Ma F, Cui A, Sun Y, et al. Thrombospondin 1 improves hepatic steatosis in diet-induced insulin-resistant mice and is associated with hepatic fat content in humans. EBioMedicine. 2020;57:102849; https://doi.org/10.1016/j.ebiom.2020.102849
[23] Mei J, Wang R, Xia D, Yang X, Zhou W, Wang H, et al. BRCA1 Is a Novel Prognostic Indicator and Associates with Immune Cell Infiltration in Hepatocellular Carcinoma. DNA Cell Biol. 2020;39:1838–49. https://doi.org/10.1089/dna.2020.5644
Peer-review Terminology
Identity transparency: Single anonymized
Reviewer interacts with: Editor
Details
This is an open access article under the terms of the Creative Commons Attribution License(http://creativecommons.org/licenses/by/4.0/), which permits use, distribution and reproduction in any medium, provided the original work is properly cited.
Publication History
Received 2025-01-16
Accepted 2025-03-23
Published 2025-03-30