




Abstract
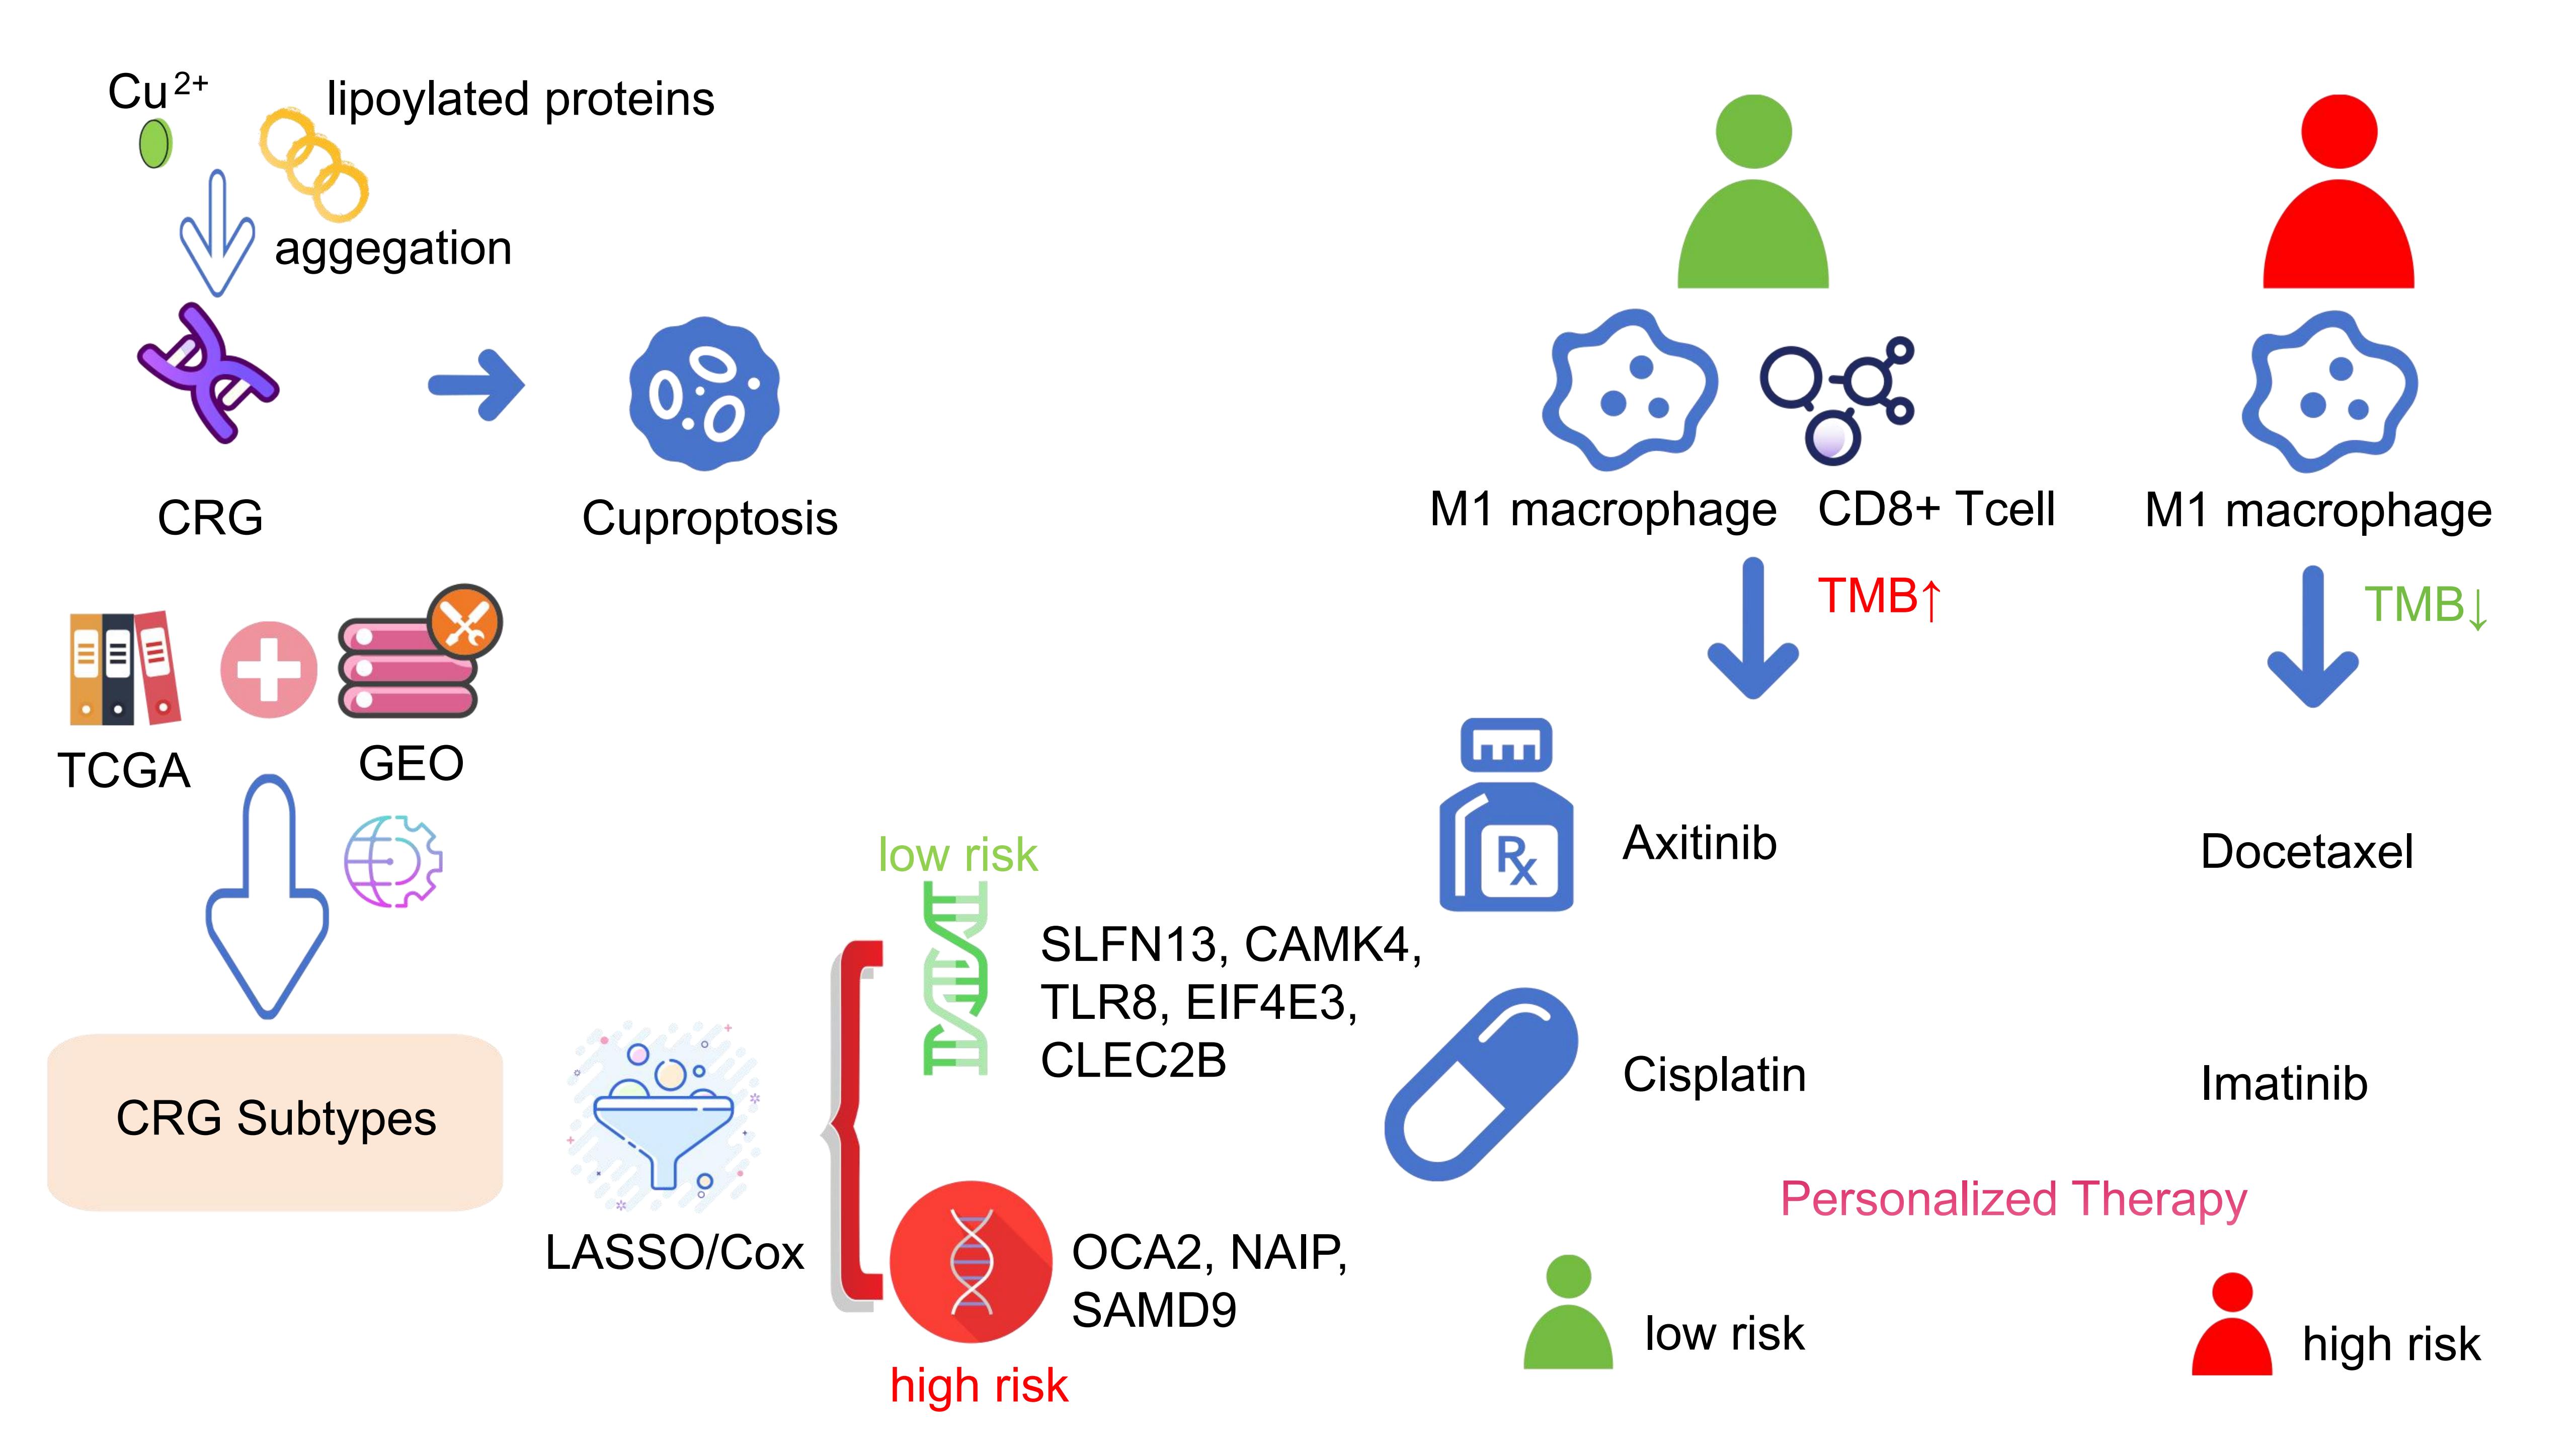
Background: Melanoma, known for its aggressive nature and poor prognosis, may be impacted by cuproptosis, a recently discovered form of programmed cell death. Despite its unclear mechanisms, preliminary studies suggested a link between cuproptosis and cancer progression and metastasis. We aimed to investigate the association between cuproptosis-related genes (CRGs) and melanoma to enhance prognostic and therapeutic strategies.
Methods: In this study, we downloaded transcriptome RNA-seqs and clinical information of all melanoma patients from The Cancer Genome Atlas (TCGA) database, selected a dataset from Gene Expression Omnibus (GEO) databases, and merged the two datasets. After univariate regression analysis, all the samples were categorized into three groups based on expression levels of CRGs. Differential expression analysis was carried out for three CRG clusters to obtain the significant differentially expressed genes (DEGs). After univariate Cox regression analysis, multivariate Cox regression analysis and the least absolute shrinkage and selection operator (LASSO) algorithm were performed on DEGs, the prognosis related genes were screened to establish a prognosis prediction model. The model's accuracy was validated through Kaplan-Meier analysis, receiver operating characteristic (ROC) curve, nomogram, and independent prognostic analysis. Additionally, we compared the immune scores of the tumor microenvironment, tumor mutation burden, tumor immune dysfunction and exclusion, and drug sensitivity between high-risk and low-risk groups.
Results: The number of COVID-19 cases were positively correlated to the overall search index values for mental illnesses (rs=0.766, p=1.041×10⁻¹²), and negatively correlated to search index values for COVID-19 (rs=-0.236, p=0.023). The searches for COVID-19 was positively correlated to the daily growth of cases (rs=0.861, p=2.310×10⁻¹⁸). No lag pattern exists between Internet searches for mental illness and the number of confirmed cases. Male and people over 50 years old searched less than other groups. Besides, the highest search behaviors appeared in southeastern China. Public search behaviors indicate that since the outbreak of COVID-19, the psychological problems of the Chinese people have been extremely prominent.Through algorithm analysis, eight genes significantly related to prognosis were identified, among which SLFN13, CAMK4, TLR8, EIF4E3, and CLEC2B were low-risk genes, OCA2, NAIP, and SAMD9 were high-risk genes. Using these genes, we established a prognostic model that effectively distinguishes between different survival outcomes, with the low-risk group showing a markedly higher long-term survival rate.
Conclusion: In conclusion, based on the research of cuproptosis subtypes, we identify the DEG with predictive potential and establish a prognosis prediction model. This study may provide a reference for the prognosis and clinical treatment of melanoma patients from the perspective of cuproptosis.
Keywords: melanoma; cuproptosis; tumor microenvironment; differentially expressed genes; risk score; bioinformatics analysis.
Introduction
Melanoma, a malignant tumor that originates from melanocytes, typically manifests in the skin [1,2]. The development of melanoma is influenced by both environmental and genetic factors [3]. Often resembling melanocytic nevi, its early symptoms can be subtle, complicating early detection and diagnosis [4]. By the time symptoms appear, melanoma frequently advances to a late stage characterized by rapid progression, widespread metastasis, and poor prognosis [5,6].
The primary treatment for metastatic melanoma has long been surgical resection combined with chemotherapy [7]. For decades, immunotherapy and targeted drugs, such as PD1 – PDL1 inhibitors, small molecule BRAF and MEK inhibitors, cytotoxic T lymphocyte antigen 4 (CTLA4) inhibitors, and the combination of multiple drugs have been explored to revolutionize the treatment of malignant melanoma [8,9]. However, not all melanoma patients respond effectively [10], and resistance to these therapies is emerging [11]. This underscores the critical need for new biomarkers that can predict prognosis and effective therapeutic targets.
Copper, an essential trace element, plays a pivotal role in various cellular functions due to its inherent redox properties [12], serving as a cofactor for enzymes involved in mitochondrial respiration, antioxidant defense, and the biosynthesis of hormones, neurotransmitters, and pigments [13]. Recent studies have highlighted that disruptions in copper homeostasis can lead to cytotoxic effects [14-16]. Tsvetkov et al. showed a unique cell programmed death mode caused by excessive copper accumulation called cuproptosis [17]. This process involves the binding of excess copper to lipoylated proteins in the tricarboxylic acid (TCA) cycle, triggering protein aggregation, loss of Fe-S cluster proteins, and resultant proteotoxic stress. Interestingly, previous studies have shown that cancer cells exhibit higher copper levels than normal tissues, suggesting that they exploit copper for energy needs while avoiding cuproptosis [13,18,19]. This seems to offer a potential therapeutic avenue targeting copper metabolism in cancer cells.
In this study, we aimed to define the role of cuproptosis in melanoma by analyzing cuproptosis-related gene (CRG) expression in patient samples. We categorized melanoma patients based on CRG expression profiles into distinct subtypes, assessed their immune characteristics, and developed a new prognostic model using differentially expressed genes (DEGs) linked to these CRG clusters. This approach may provide valuable insights for enhancing melanoma diagnosis and treatment strategies.
Materials and Methods
Data Collection and Preparation
Transcriptomic RNA-seq and clinical data were acquired from The Cancer Genome Atlas (TCGA) database and the GSE65904
dataset from Gene Expression Omnibus (GEO). After screening, samples lacking complete survival information or from
normal tissues were excluded. The remaining transcriptomic and clinical data were merged from both sources.
Additionally, somatic mutation and copy number variation (CNV) were downloaded from GDC and UCSC Xena, respectively.
We utilized 18 CRGs
(NFE2L2、NLRP3、ATP7B、ATP7A、SLC31A1、FDX1、LIAS、LIPT1、DLD、DLAT、PDHA1、PDHB、MTF1、GLS、CDKN2A、DBT、GCSH、DLST)
identified from previous studies [13,17,18,20,21].
CNV analysis and prognosis analysis of CRGs
CNV of CRGs was extracted from the CNV file downloaded from TCGA. We analyzed the difference and used the R package
“RCircos” (version 1.2.2) for visualization. To validate the prognostic value of CRGs, survival analysis and
univariate Cox regression analysis were conducted on the merged data using the R package “limma” (version 3.64.3) and
“survival” (version 3.8.3). According to the relationship between high and low gene expression and survival
information, CRGs were divided into “Favorable factors” and “Risk factors”.
Consensus clustering analysis with CRGs
R package “ConsensusClusterPlus” (version 1.58.0) was run to cluster the expression differences of these 18 CRGs in
the merged sample dataset. The samples were divided into different clusters based on the result of cuproptosis
clustering. Kaplan-Meier analysis was conducted to compare survival probability differences among different CRG
clusters. In addition, the principal component analysis (PCA) diagram showed the geometric distance between
subclusters. The heatmap showed the difference of CRGs expression. Gene set variation analysis (GSVA) was conducted to
present the differences in immune pathway enrichment between the three clusters. Single sample gene-set enrichment
analysis (ssGSEA) algorithm was performed to compare the immune cell infiltration of different CRG clusters, and we
visualized the results with R package "ggpubr" (version 0.6.1).
Identification of CRG clusters related DEGs and function enrichment analysis
Differential expression analysis was carried out for three CRG clusters to obtain the DEGs. The intersection of DEGs
across the three clusters was further analyzed. GO and KEGG function enrichment analyses were conducted for these
DEGs.
Obtaining DEG clusters
We performed univariate Cox regression analysis on the DEGs to get the significant DEGs and conducted the consensus
unsupervised clustering analysis for these DEGs. The merged sample data was divided into different DEG clusters.
Kaplan-Meier (K-M) survival analysis was performed to show the survival differences among DEG clusters. The heat map
was drawn to describe the differential expression of DEG clusters, and the boxplot described the differential
expression of CRGs among DEG clusters.
Prognostic Model Construction and Validation
Prognostic genes were determined using multivariate Cox regression, and LASSO algorithm. To prevent overfitting, the
optimal penalty coefficient was obtained through cross validation of 1000 iterations. The prognostic CRG clusters
related DEGs optimal group was determined, and a prognostic risk model was established using multivariate Cox
regression from DEG signature, with patients' risk scores calculated as follows: Risk score = Σ(expi ×
coefi), “exp” means gene’s expression, “coef” means corresponding coefficient. The patients were randomly
divided into training and test sets (1:1 ratio), and the training set, the test set, and all patients were further
divided into high-risk and low-risk groups based on median risk scores, respectively. Kaplan-Meier analysis was
carried out by “survival” R package to compare the long-term survival probability between the training set, test set,
low-risk group, and all patients. In addition, based on the “survival” (version 3.8.3), “survminer” (version 0.4.2),
“timeROC” (version 0.4) R package, we created the receiver operating characteristic (ROC) curves of 1-, 3-, and
5-years and calculated the area under the curve (AUC) to compare the testing effectiveness.
Establishment of Predictive Nomogram
We combined various key clinical factors with risk scores and used the “rms”, “regplot” R package to construct 1-year,
3-year, and 5-year nomographs to predict the long-term survival rate of melanoma patients. And to verify the
reliability of the model, we drew a calibration curve according to the Hosmer – Lemeshow test. The independence of the
prognostic model from clinical factors such as sex, age, and pathological stage was confirmed through univariate
regression and multivariate regression analysis.
Analysis of immune microenvironment (TME), tumor mutation burden (TMB), and tumor immune dysfunction and exclusion
(TIDE)
The CIBERSORT method was used to analyze the difference in immune infiltration of total melanoma samples. We used the
R package “ESTIMATE” to evaluate immune scores, stromal scores, and estimate scores of TME. This algorithm can use
gene expression characteristics to estimate the level of stromal cells and immune cells in malignant tumor tissues. We
also run the "maftools" R package (version 2.24.0) to analyze the TMB and compare the gene mutation differences
between high-risk group and low-risk group. And TIDE was downloaded from TIDE website (http://tide.dfci.harvard.edu)
to predict patients' response to immunotherapy [22,23].
Drug sensitivity analysis
According to the Genomics of Drug Sensitivity in Cancer (GDSC, https://www.cancerrxgene.org/) database, the
"pRRophetic" package (version 0.5) in R was applied to compare the difference between high-risk groups and low-risk
groups in sensitivity to chemotherapy drugs.
Statistical analysis
All statistical analyses in this study were performed using R software (version 3.6.1) and PERL. A p-value of less
than 0.05 (two-sided) was considered to indicate statistically significant differences. Univariate Cox regression
analysis was utilized to identify DEGs with prognostic value. We constructed the prognostic prediction model using the
LASSO regression algorithm, univariate Cox regression analysis, and multivariate Cox regression analysis.
Results
CNV and prognosis value of CRGs
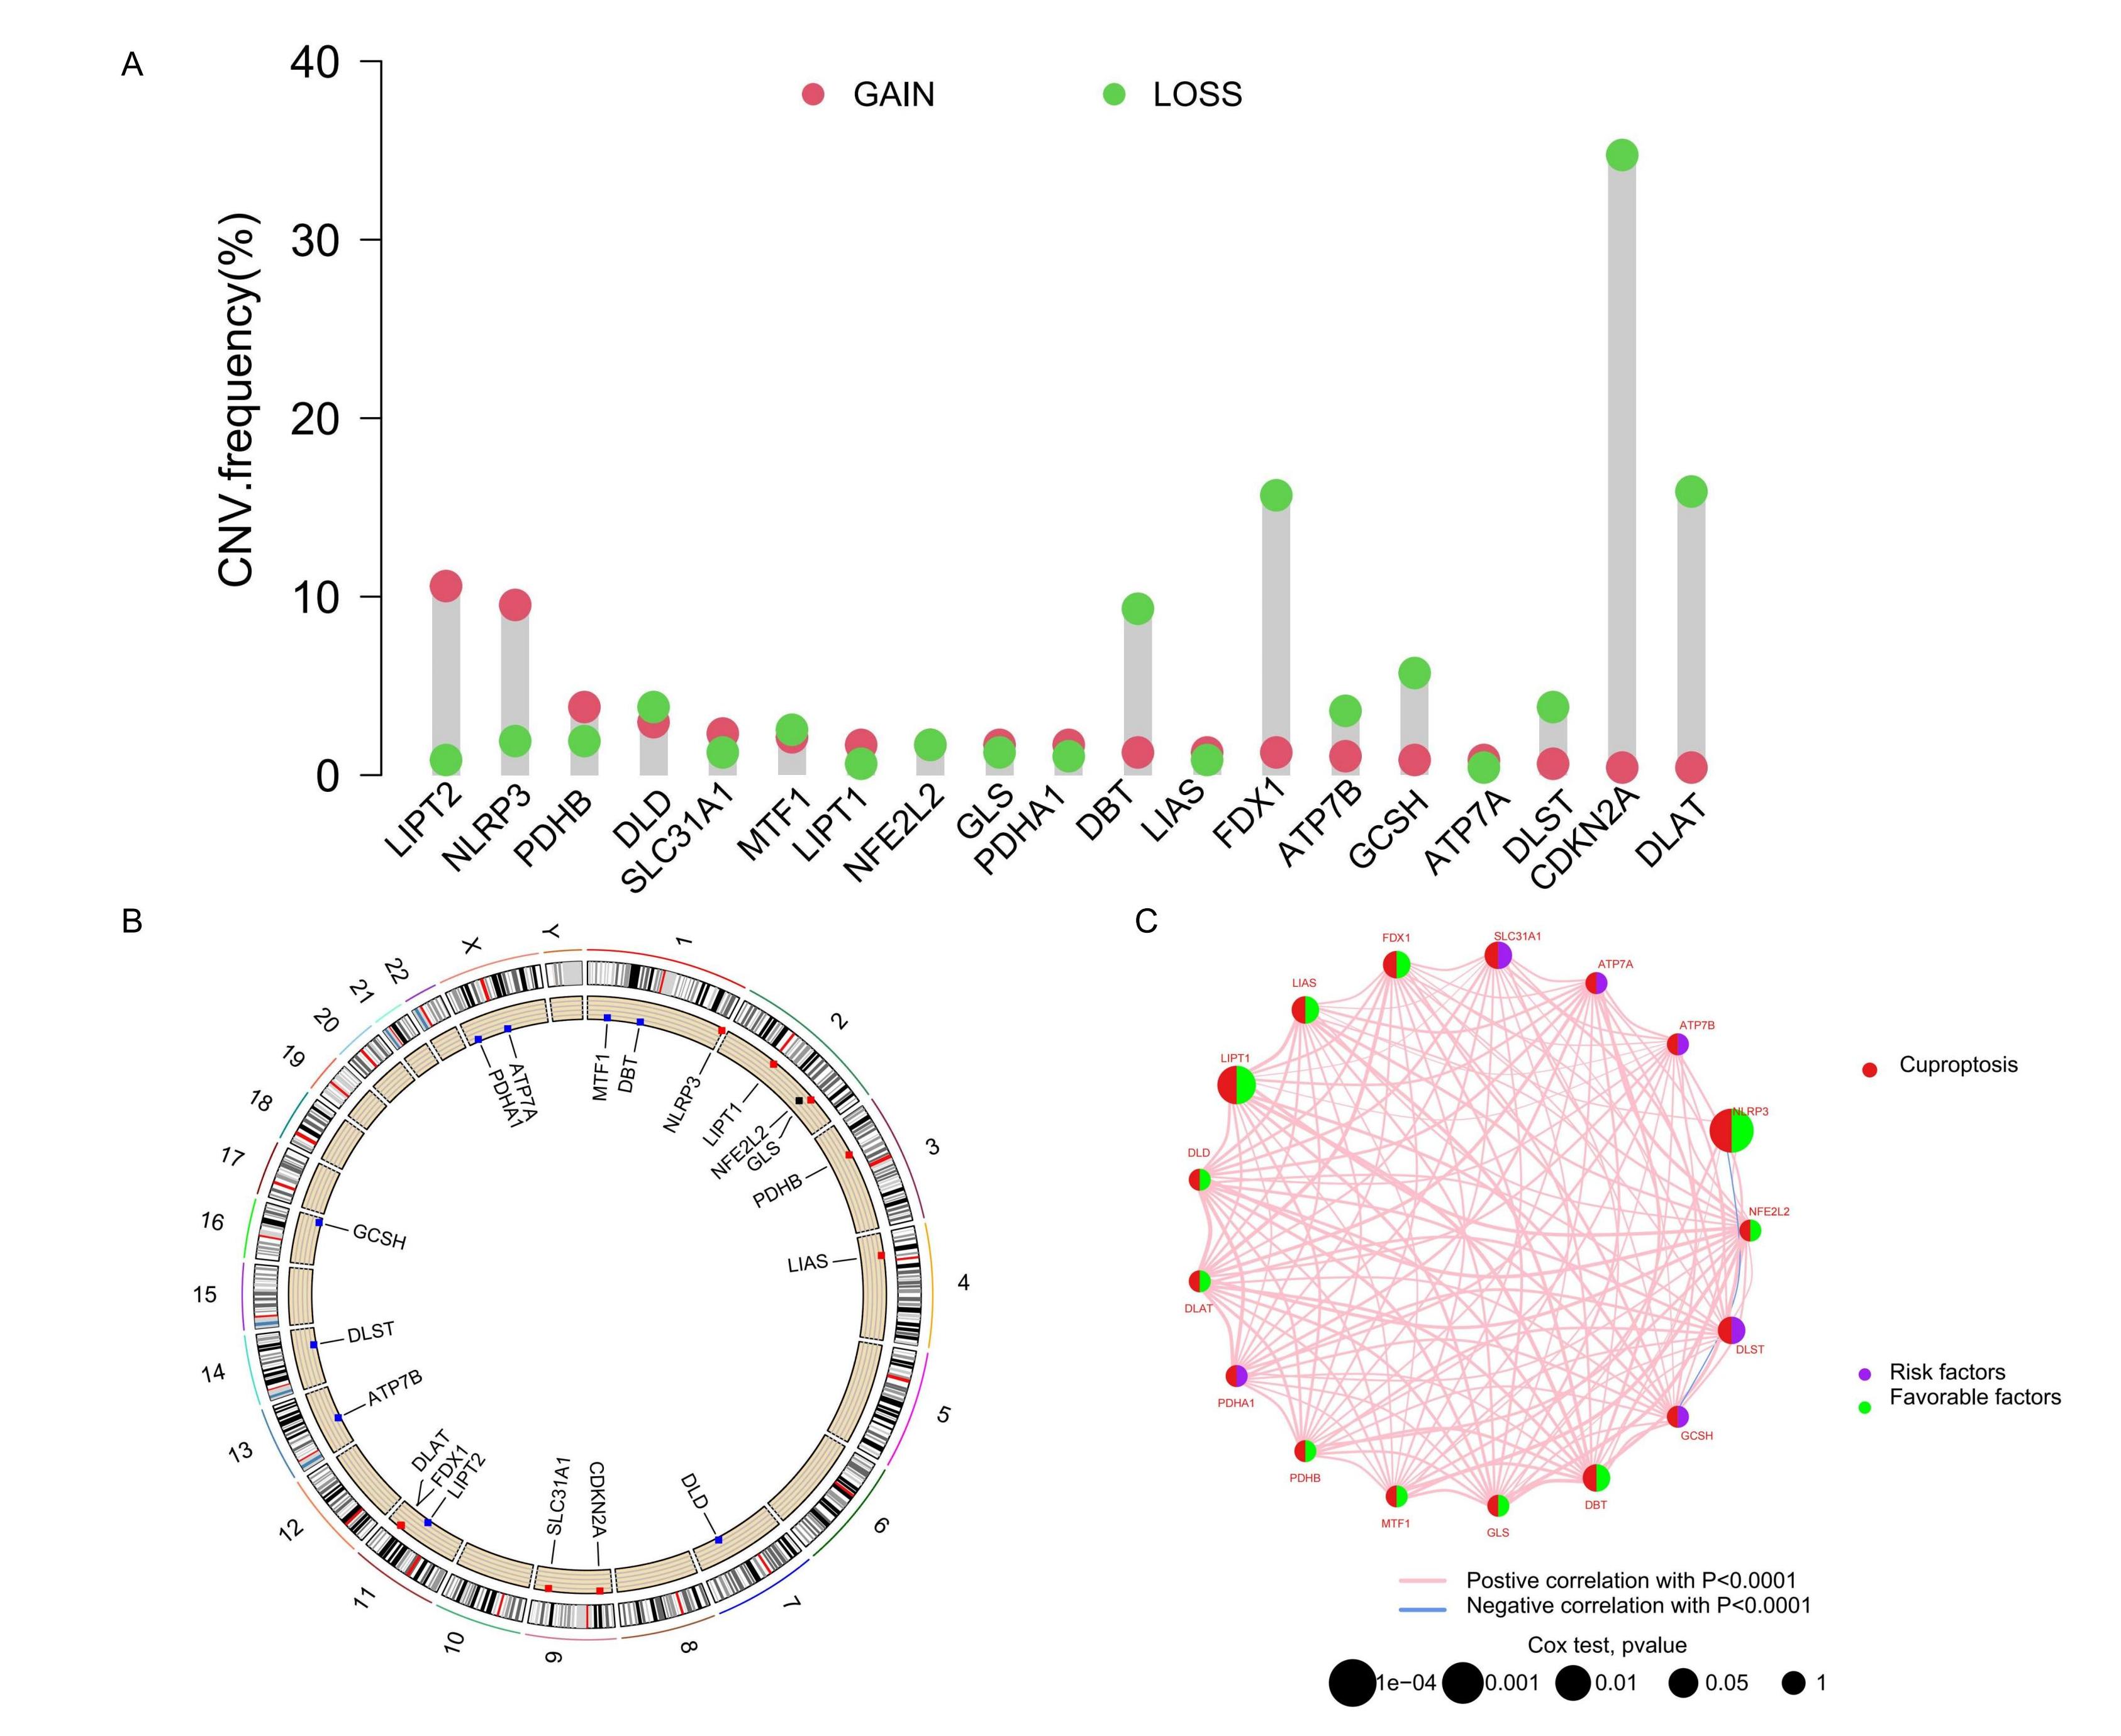
Analysis of the CNV in 18 CRGs highlighted significant reductions in CDKN2A, DLAT, GCSH, FDX1, and DBT, with increases
observed in NLRP3. These variations suggested distinct patterns of transcription and expression of CRGs in tumor
samples (Figure 1A), potentially reflecting their involvement in tumor development, progression, or
other molecular mechanisms. Chromosomal locations of CRGs, with increases marked in red and decreases in blue, are
displayed in Figure 1B. To further assess the prognostic significance of these CRGs, we integrated
transcriptome RNA sequencing data with clinical information from the TCGA and GEO databases and conducted Kaplan-Meier
survival analysis. The analysis revealed significant differences in overall survival between high and low expression
groups for 15 CRGs, including ATP7A, ATP7B, CDKN2A, DBT, DLD, DLST, FDX1, GCSH, LIAS, LIPT1, MTF1, NFE2L2, NLRP3,
PDHA1, and SLC31A1 (see Supplementary Figure S1A-O online). Based on the survival curves
from this analysis, we categorized the CRGs into "Risk factors" and "Favorable factors," which are illustrated in a
network diagram (Figure 1C).
Figure 1. Genomic variation of CRG. (A) The change of CNV frequency of CRGs. (B) CRG position of CNV on the chromosome. (C) The interaction between CRGs in melanoma, where the width of the line represents the strength of the correlation between CRGs.
Consensus clustering analysis with CRGs
To clearly delineate the characteristic distribution of CRGs across varying expression levels in all samples, we
performed consensus clustering analysis on the transcriptome data, simulating group numbers from k=2 to k=9. The
classification was most distinct at k=3, effectively reflecting the differences in expression and potential biological
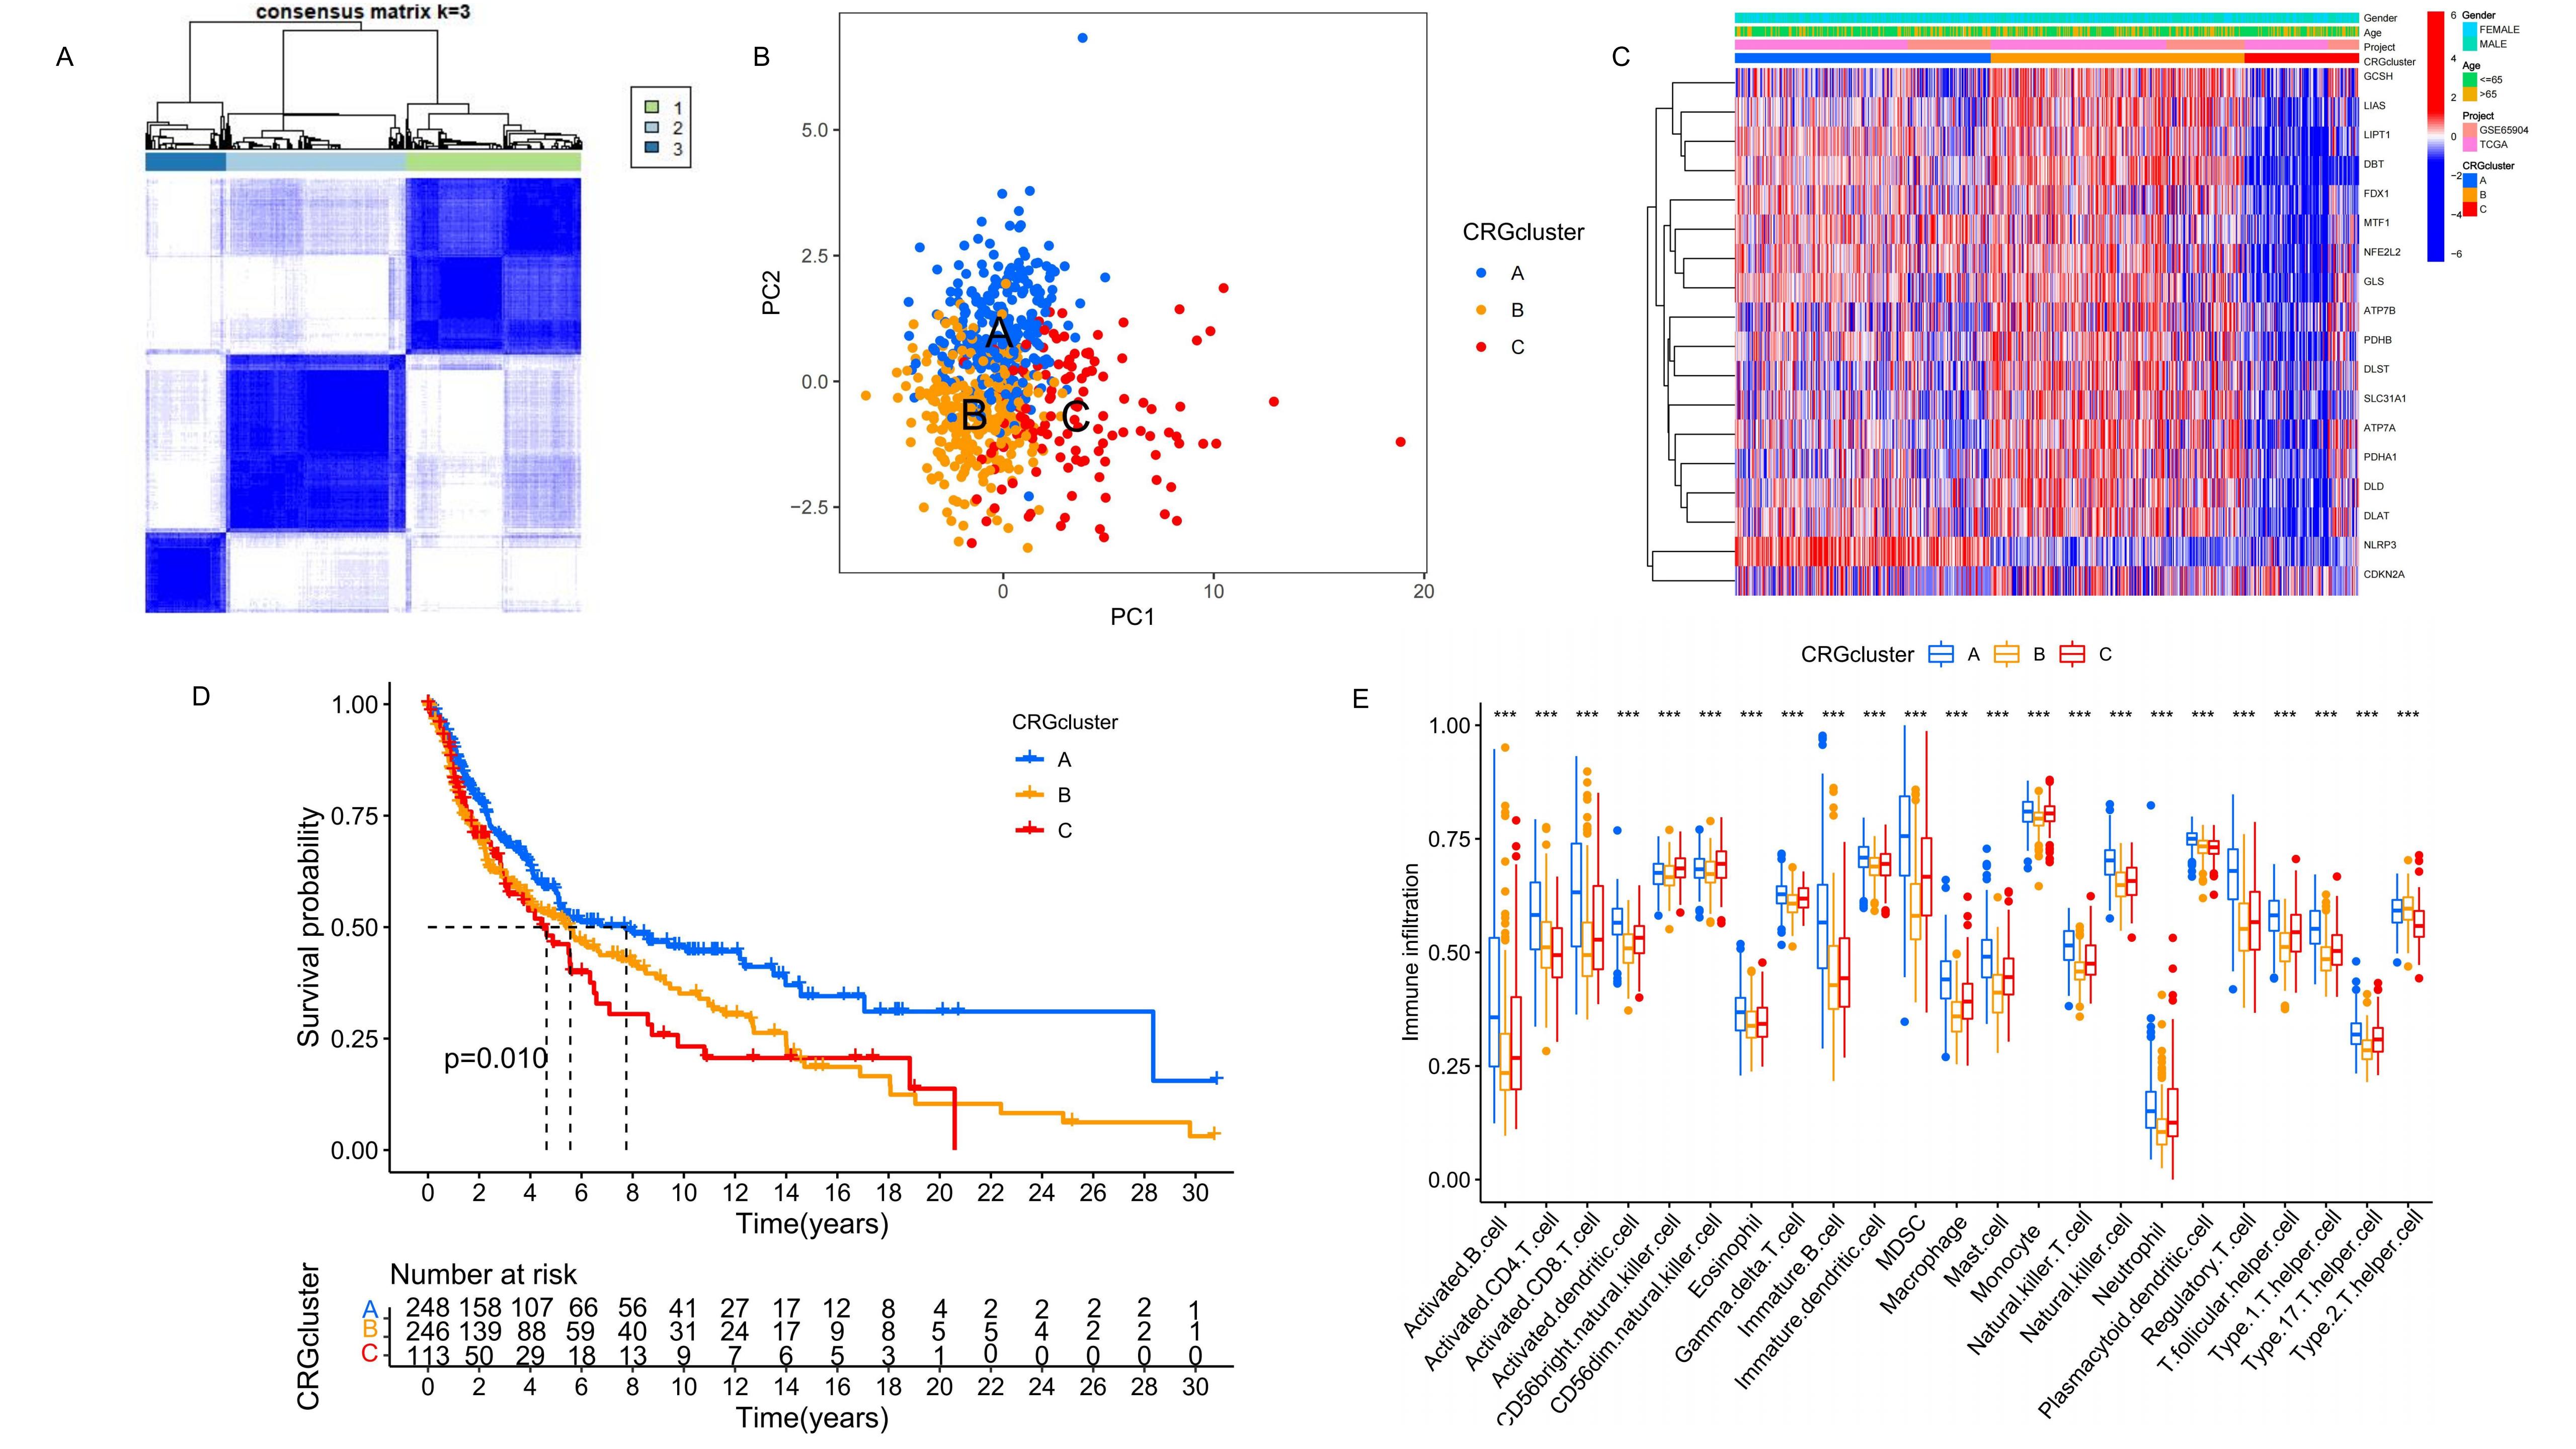
diversity among the samples. Consequently, we divided the samples into three CRG clusters: A (n=276), B (n=280), and C
(n=126), based on their expression characteristics related to risk and Favorable factors (Figure 2A). PCA results revealed significant differences in gene expression profiles among the three CRG clusters (Figure 2B), suggesting that different clusters may represent distinct biological states. The heat map showed the differential
expression of CRG among the three clusters and different clinical features (Figure 2C). Further, K-M
survival analysis of the three CRG clusters indicated significant differences in survival outcomes, with CRG cluster A
exhibiting a notably higher long-term survival probability than clusters B and C (Figure 2D). In
addition, GSVA results highlighted the top 20 most significant pathways differing among clusters A, B, and C (see
Supplementary Figure S2A-C online). Analysis of immune cell proportions in the three
clusters was conducted using ssGSEA (Figure 2E). The results demonstrated varying types of immune
cell infiltration across the melanoma samples, identifying potential therapeutic targets within these immunological
variations.
Figure 2. Identification and analysis of the CRG clusters. (A) Unsupervised consensus clustering identified three molecular subtypes of cuproptosis. (B) The PCA results show the distribution of the three CRG clusters. (C) It shows the differential expression of CRG among the three CRG clusters and different clinical features. (D) The K-M survival analysis of the 3 CRG clusters. (E) The immune infiltration difference of TME in the three clusters.
Identification of CRG clusters related DEGs and immune function enrichment analysis
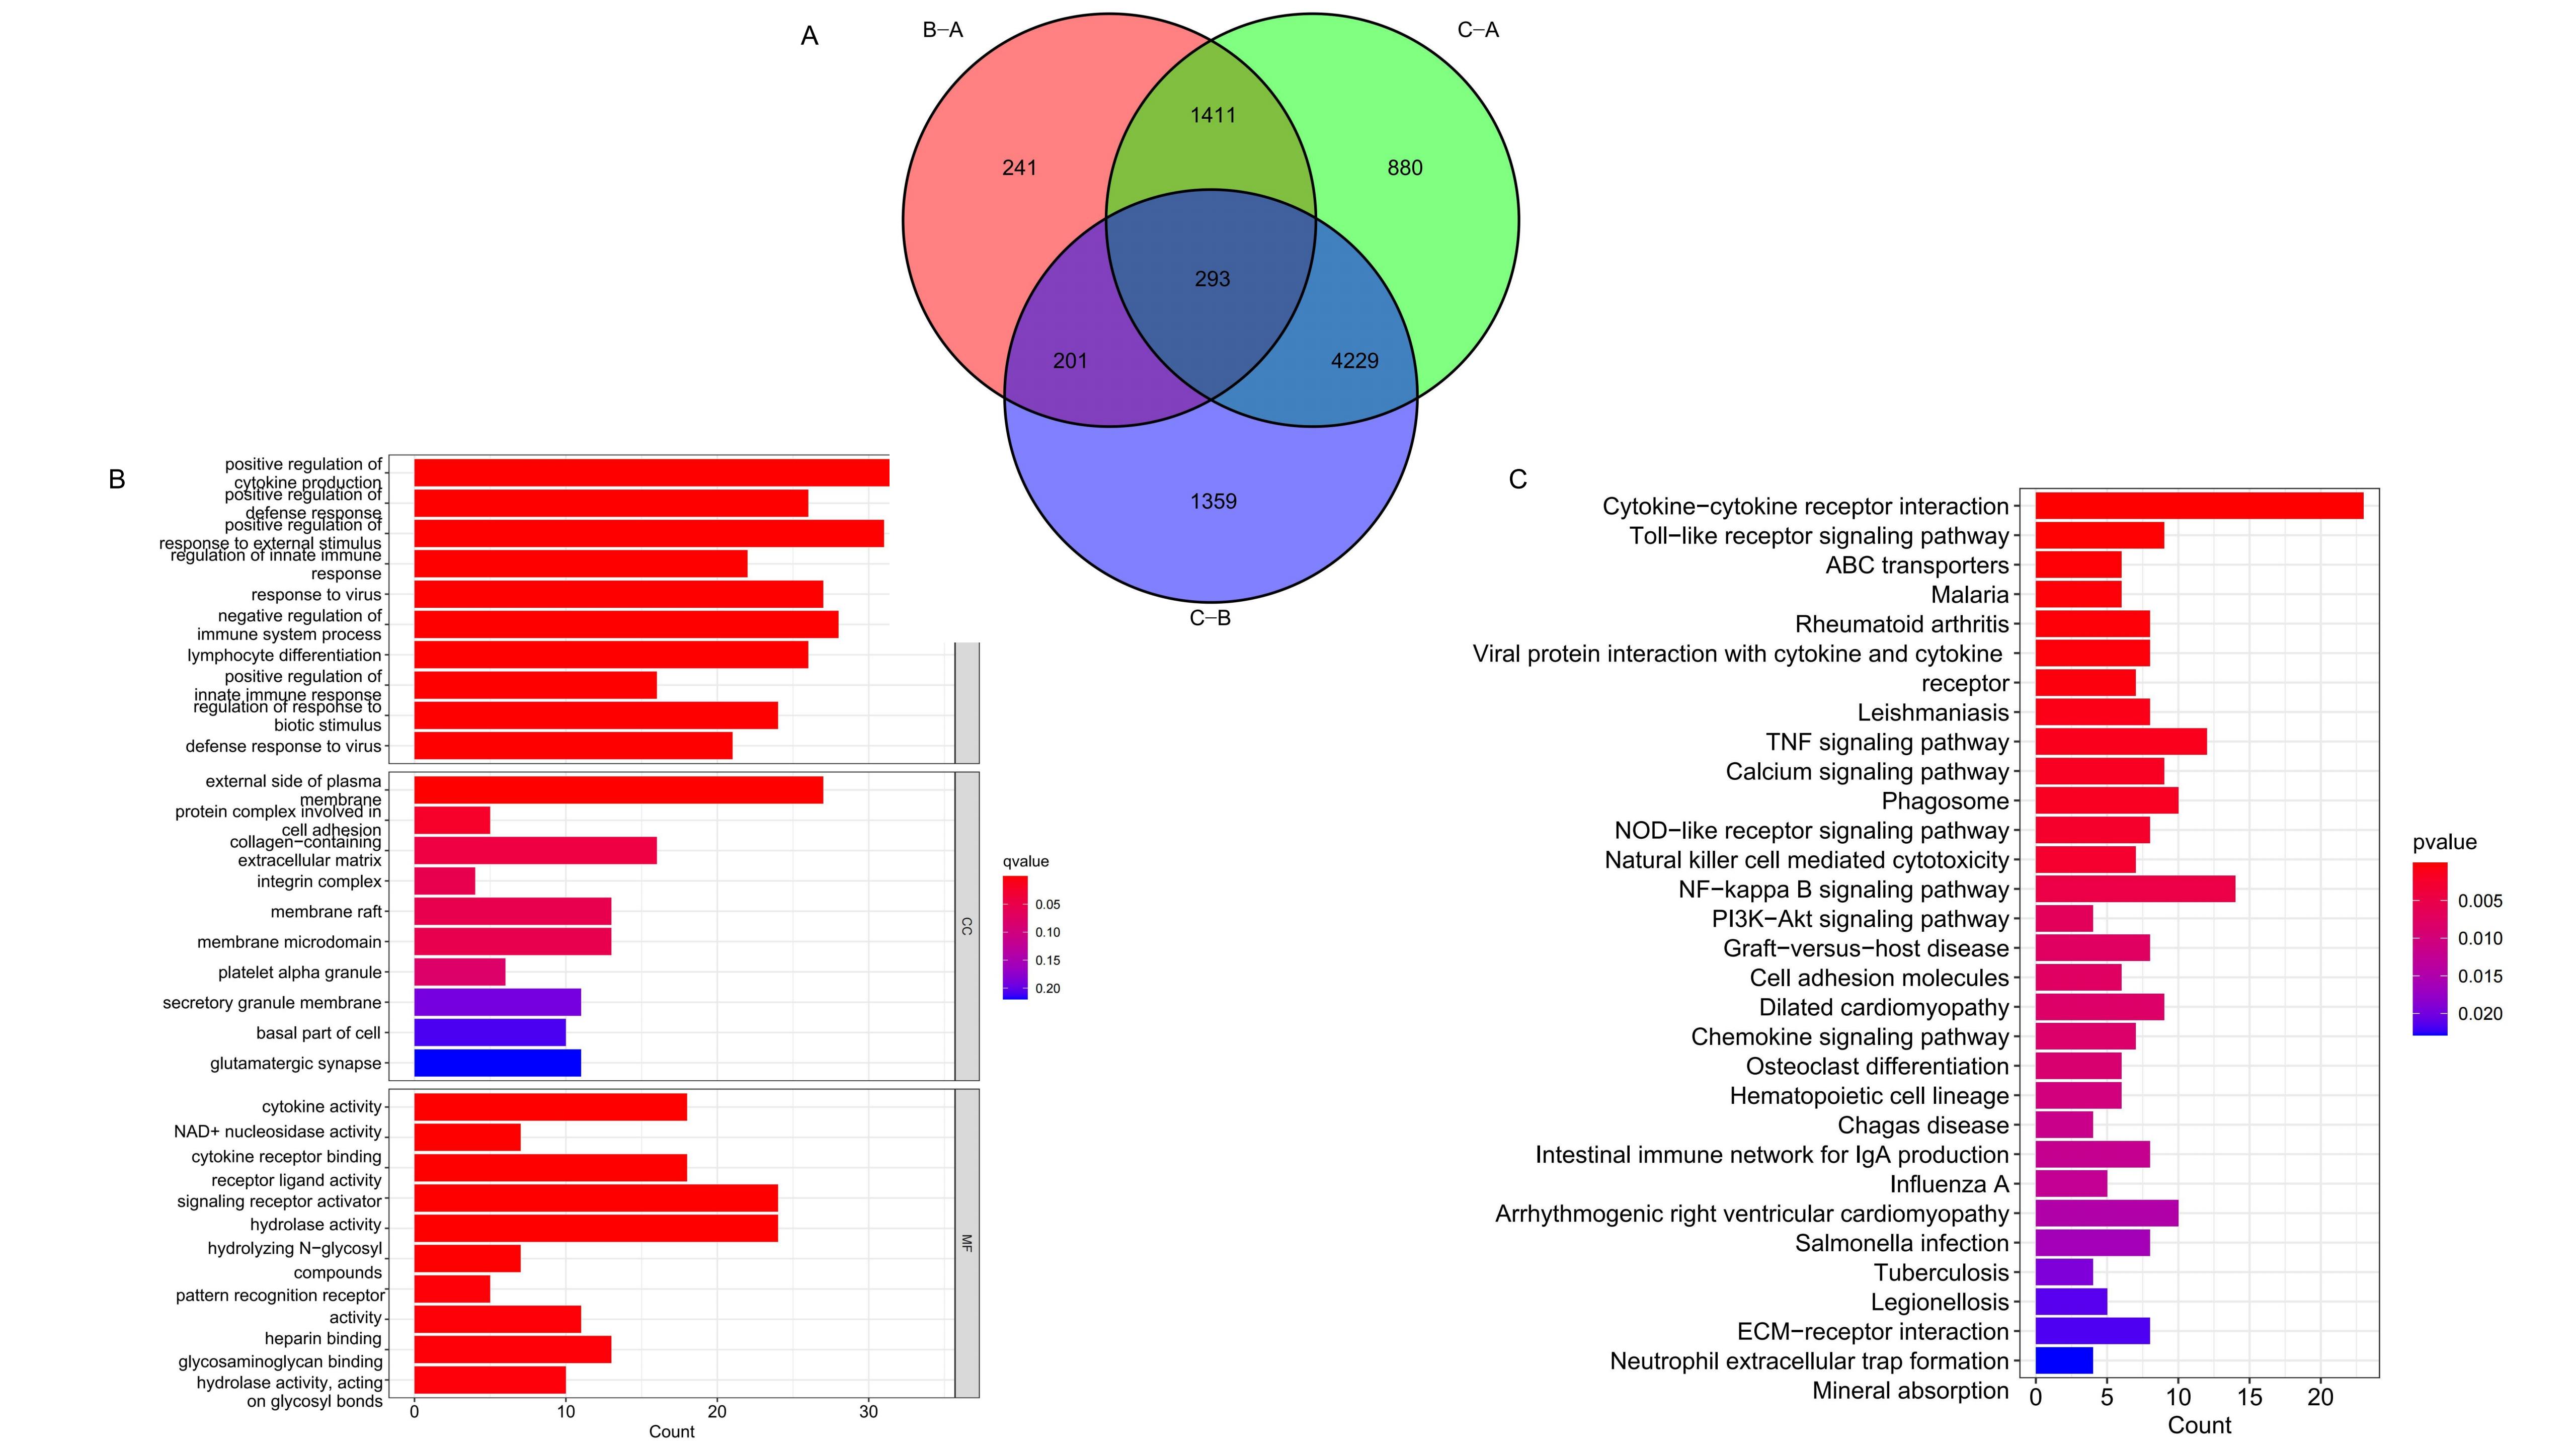
Differential expression analysis across the three CRG clusters identified intersecting DEGs, presented in a Venn
diagram (Figure 3A). Subsequent immune function enrichment analyses using GO and KEGG were conducted
on these intersecting DEGs. The GO analysis identified significant enrichment in Molecular Function (MF) and
Biological Process (BP) categories (Figure 3B,
Supplementary Figure S3A) . KEGG enrichment analysis further demonstrated significant
differences in the expression of DEGs within cytokine-cytokine receptor interaction, Toll-like receptor signaling
pathway, and PI3K-Akt signaling pathway, etc (Figure 3C, Supplementary Figure S3B). These findings
highlight the significant impact of DEGs associated with CRG clusters on immune regulation within melanoma.
Figure 3. GO and KEGG analysis of the CRG clusters related DEGs. (A) Intersection DEGs of three CRG clusters. (B-C) Visualization of GO and KEGG analysis results.
Obtaining DEGs clusters
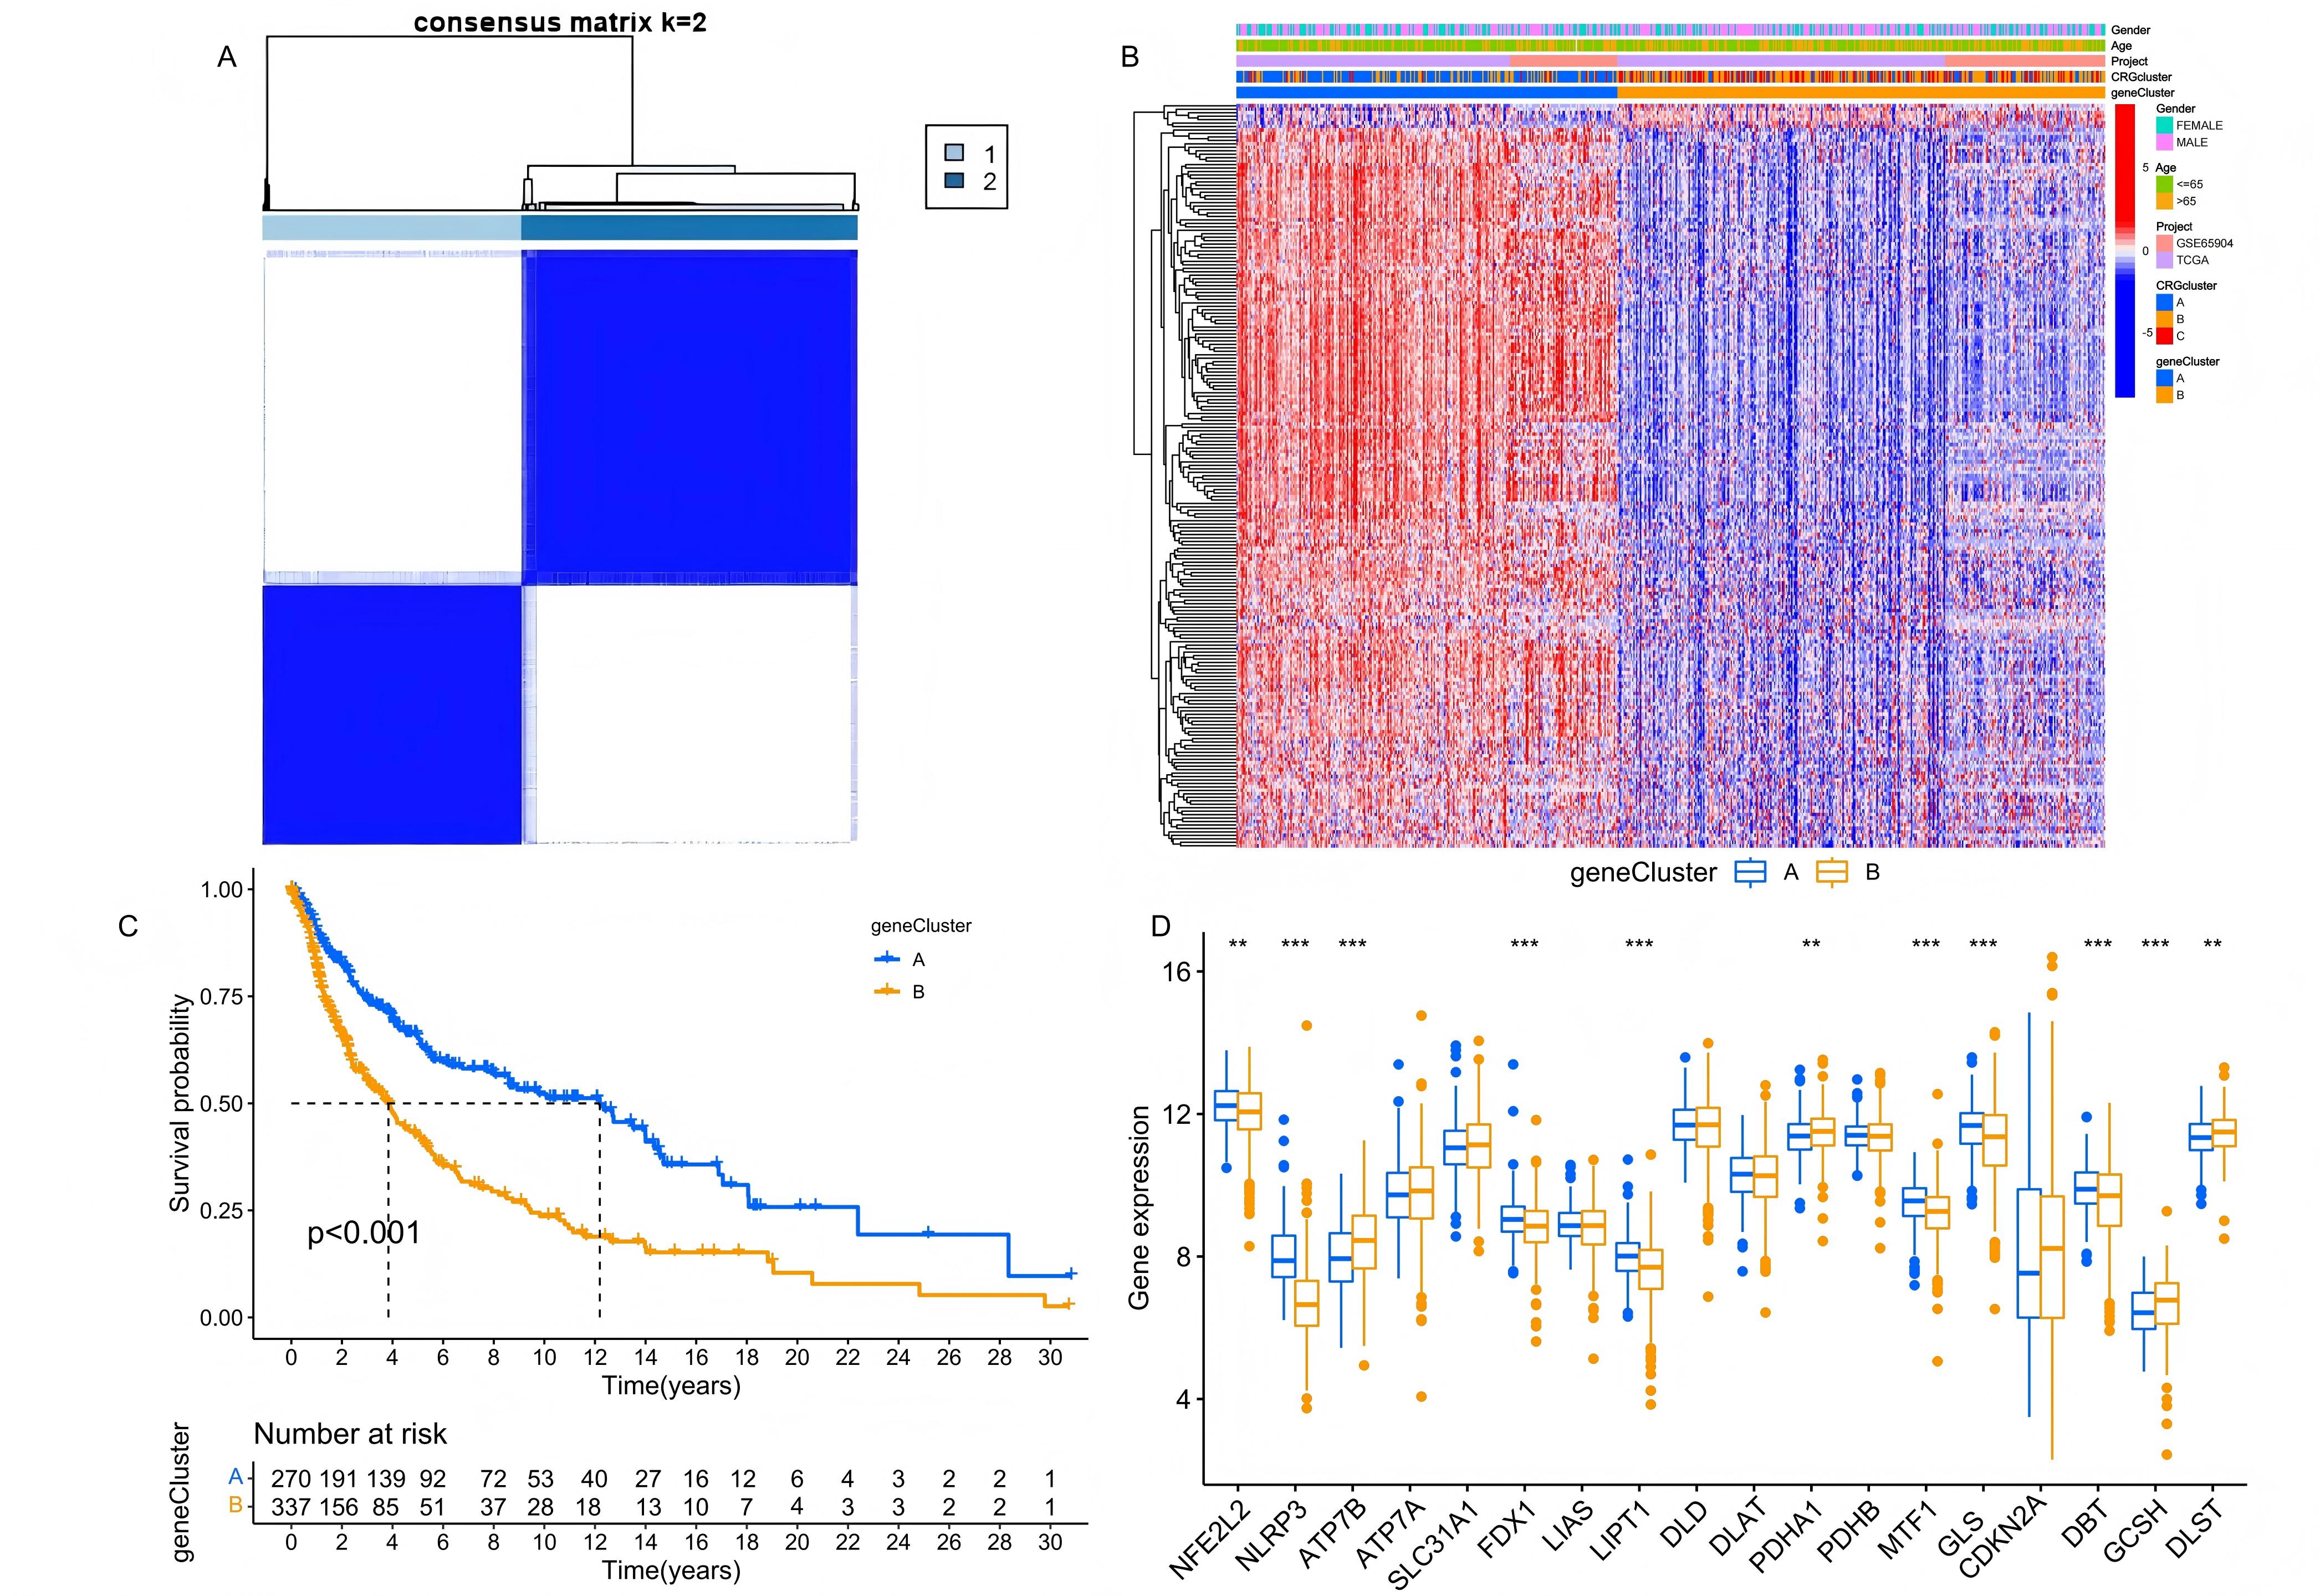
Significant DEGs were obtained through univariate Cox regression analysis. Based on the expression differences, we
conducted a grouping simulation, finding that categorizing the samples into two clusters (A and B) provided the most
distinct grouping performance (Figure 4A). Subsequently, K-M survival analysis revealed that the
long-term survival probability of samples in cluster A was significantly higher than in cluster B (Figure 4B). Additionally, we combined the characteristic of CRG clusters and population drew a heatmap of gene expression
differences (Figure 4C). The differences in CRG expression between the two DEG clusters were further
detailed in a boxplot (Figure 4D), where risk factors such as ATP7B, DLST, GCSH, and PDHA1 showed
notably higher expression in cluster B. These findings highlight the potential of these DEGs in predicting prognosis
in melanoma patients, and also suggested the possible role of CRGs in melanoma progression.
Figure 4. Age distribution of the searches for 12 topics regarding mental illness from 8 December 2019 to 9 March 2020.Identification and analysis of the DEG clusters. (A) Unsupervised consensus clustering identified two DEG clusters. (B) The K-M survival analysis of the DEG clusters. (C) The clinical characteristics and cuproptosis subtypes differences between the two DEG subtypes. (D) The differences in CRG expression between the two DEG clusters.
Construction of prognostic model
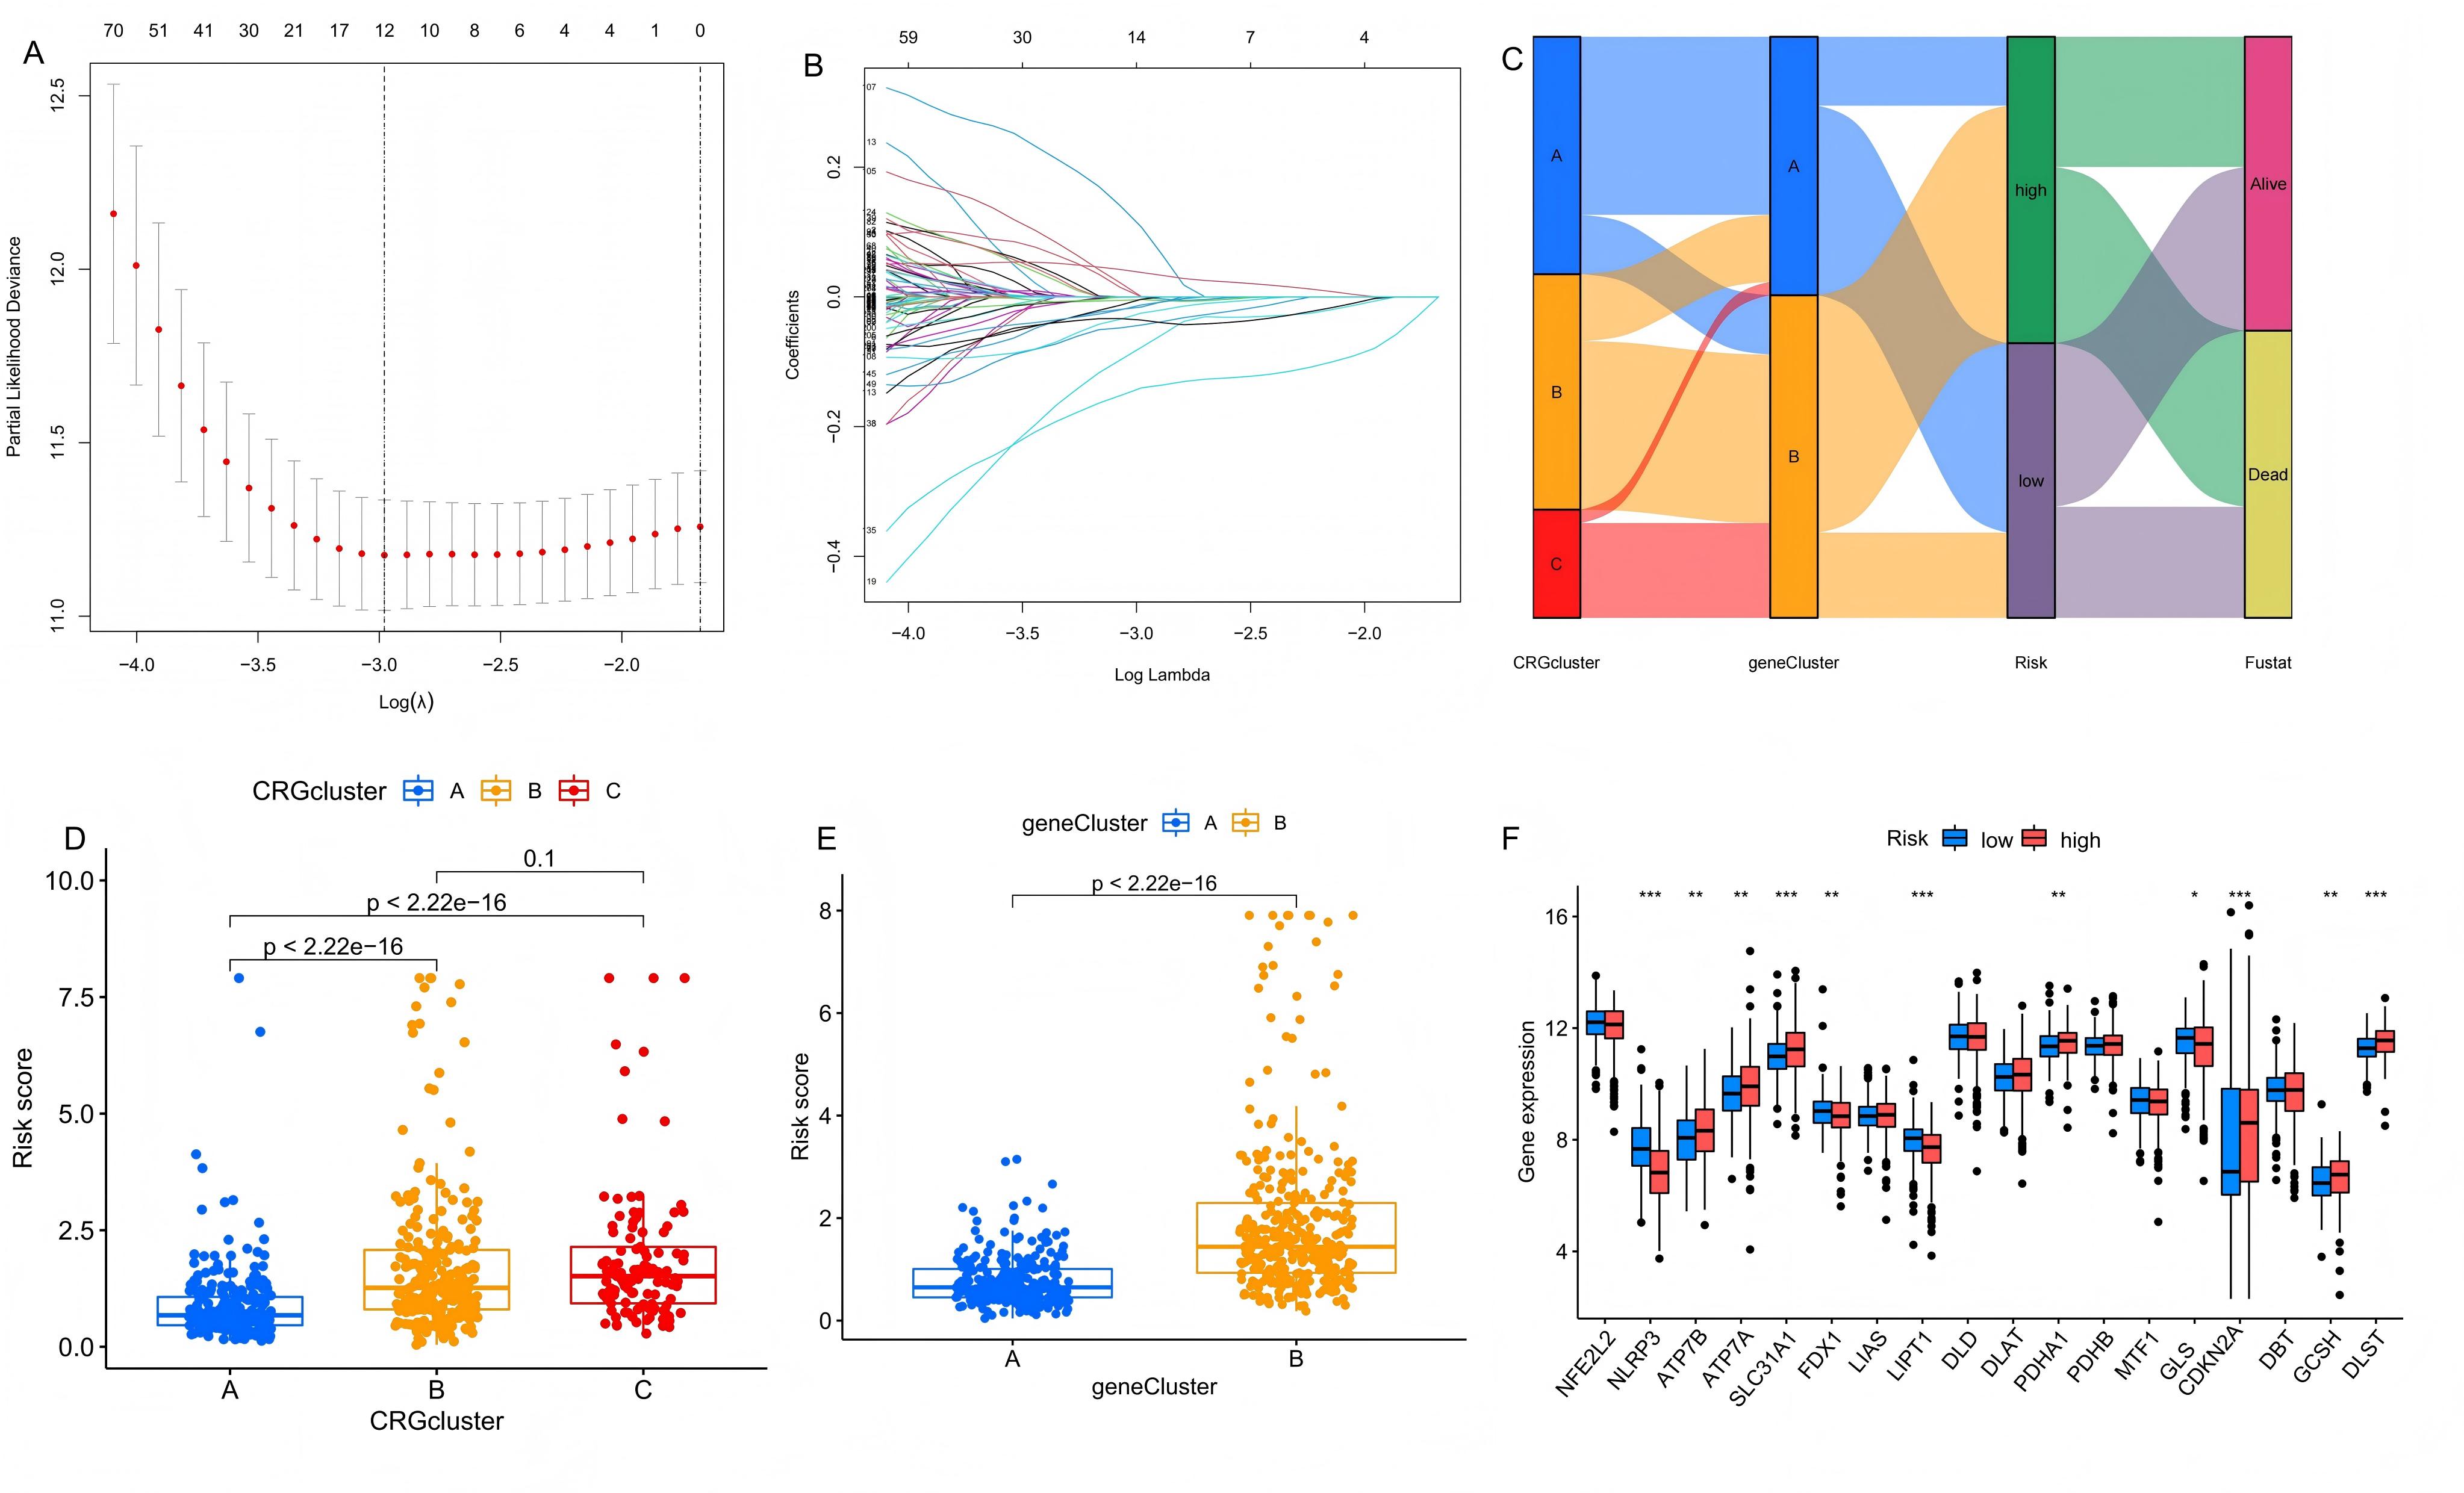
The LASSO algorithm analysis and multivariate Cox regression analysis were applied to 293 DEGs intersecting across
three CRG clusters, as shown in Figure 5A and 5B. After 1,000 iterations, this
analysis identified a prognostic model composed of eight genes—SLFN13, CAMK4, TLR8, EIF4E3, CLEC2B, OCA2, NAIP, and
SAMD9—which exhibited substantial prognostic relevance. The risk score for this model was calculated as follows: Risk
score = exp (TLR8) × (-0.266) + exp (SAMD9) × 0.252 + exp (NAIP) × 0.465 + exp (EIF4E3) × (-0.152) + exp (CLEC2B) ×
(-0.271) + exp (SLFN13) × (-0.121) + exp (CAMK4) × (-0.103) + exp (OCA2) × 0.091. Using this signature, we calculated
risk scores for all samples, classifying them into high and low-risk groups based on the median score. A Sankey
diagram (Figure 5C) illustrated the relationships between CRG clusters, DEG clusters, risk groups,
and survival outcomes, highlighting the efficacy of CRG and DEG classifications in predicting melanoma patient risk
and survival. The boxplot showed the risk score variations in CRG clusters (Figure 5D) and DEG
clusters (Figure 5E), revealing that groups with higher long-term survival probabilities,
specifically CRG Cluster A and DEG Cluster A, had lower risk scores. Additionally, boxplots comparing high and
low-risk groups (Figure 5F) showed significant differences in the expression of CRGs, where risk
factors such as SLC31A1, ATP7A, ATP7B, DLST, GCSH, and PDHA1 are significantly elevated in the high-risk group. These
findings underscore the reliability of our prognostic model.
Figure 5.Construction of the prognostic model. (A-B) LASSO regression analysis screened prognostic signatures from the DEGs to build the model. (C) The relationship among CRG clusters, DEG clusters, risk groups and survival status. (D) Distribution of risk scores across the three CRG clusters. (E) Distribution of risk scores across the two DEG clusters. (F) Comparison of CRG expression between the high-risk group and low-risk group.
Verification of the Prognostic Model
A total of 607 melanoma patients were randomly divided into a test set (303 samples) and a training set (304 samples),
nearly a 1:1 ratio, to assess the effectiveness of the risk prediction model. K-M survival analysis was conducted on
all samples, training set and test set categorized by high and low-risk groups, consistently showed that the long-term
survival probability of the low-risk group was significantly higher than that of the high-risk group (Figure 6A-C). This finding confirmed that the risk prediction model effectively differentiates patients with varying prognostic
levels. Expression differences of prognostic signature genes between the high-risk and low-risk groups were visualized
using heatmaps across all samples, training, and test sets (Figure 6D-F). Scatter plots depicting
the survival time against increasing risk scores indicated that higher scores were associated with a significant
increase in mortality and a notable decrease in survival time (Figure 6G-L). To evaluate the
sensitivity and specificity of the prognostic model, we drew the ROC curve, the AUC of 1-, 3- and 5-year were 0.680,
0.758, and 0.785 in training set, and the minimum AUC of all the samples and test set was 0.647 (Figure 6M-O). These results emphasize the model's strong predictive capability for long-term prognosis, even at the lowest AUC
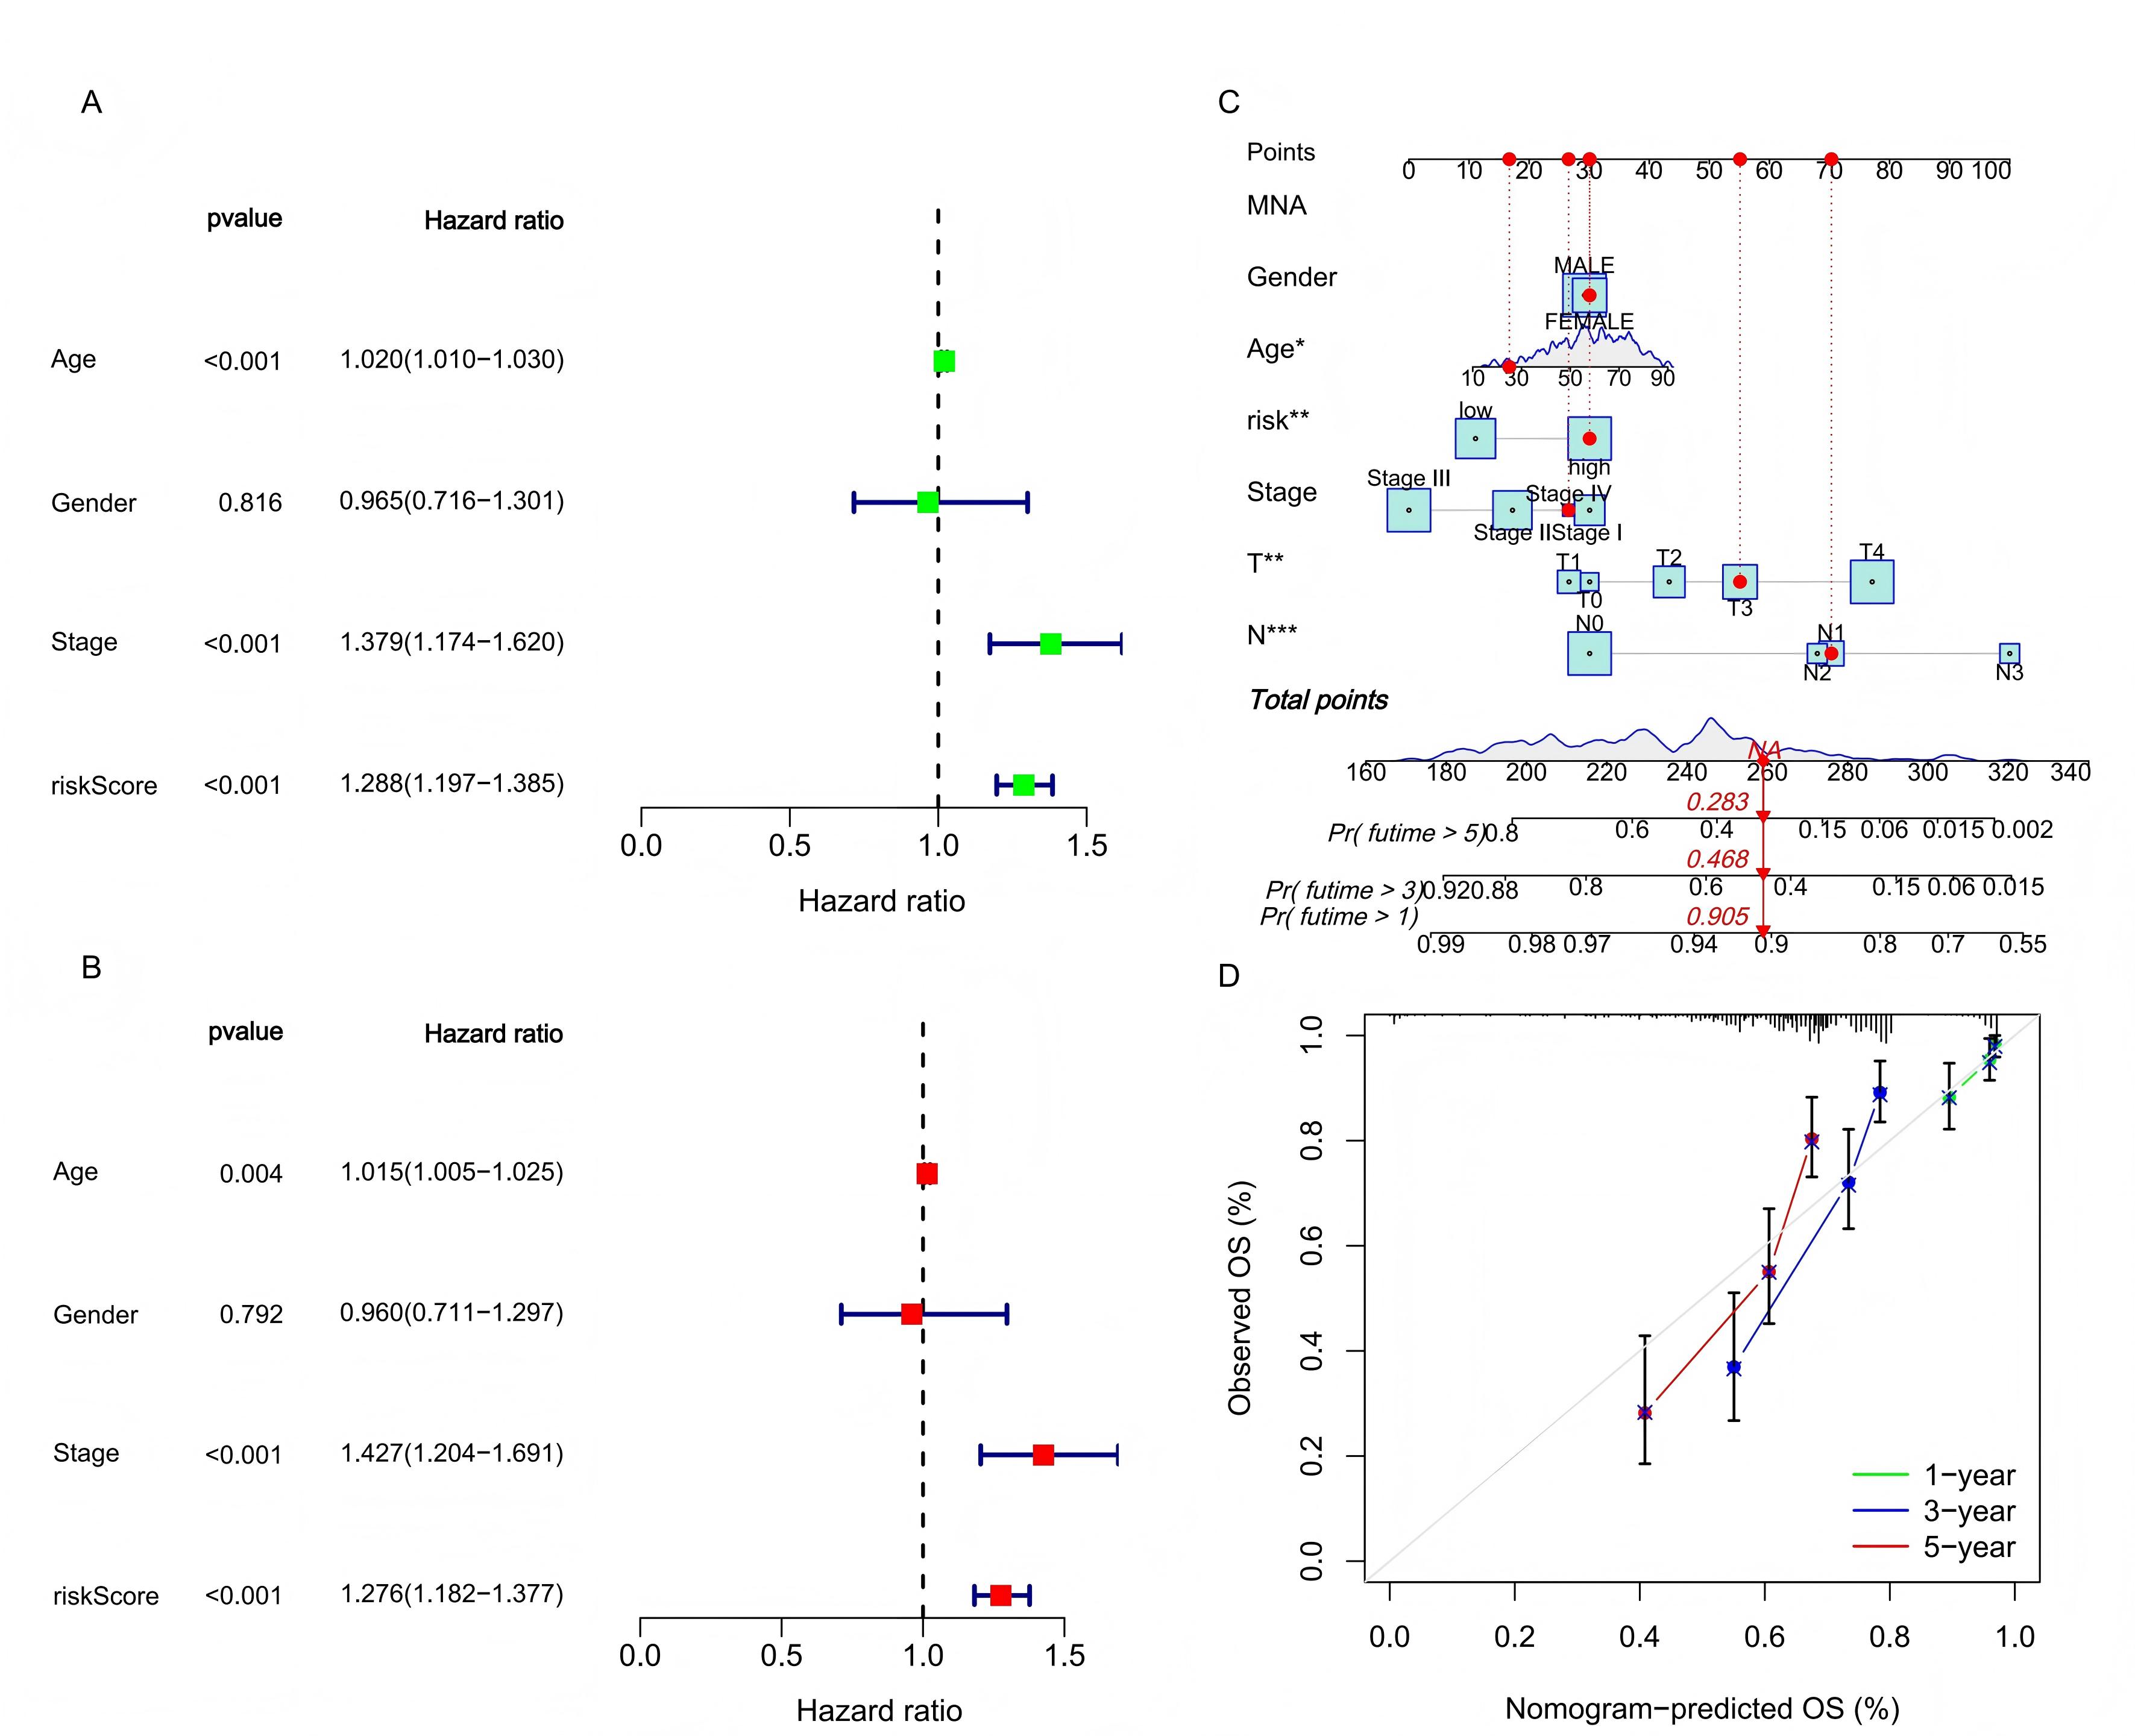
value. Further verification of the model’s reliability as an independent predictor was conducted using univariate and
multivariate Cox regression analyses. The hazard ratio (HR) values of risk score showed that it could be regarded as
an independent prognostic indicator alongside clinical characteristics (Figure 7A-B). To enhance
clinical applicability, a nomogram integrating clinicopathological features and risk scores was developed to
quantitatively predict 1-year, 3-year, and 5-year survival probabilities for melanoma patients (Figure 7C). As shown in Figure 7C, if the total risk score of a patient is 258 points, then in the
prediction of this model, the survival probability of this patient in the next 1 year, 3 years and 5 years is 90.5%,
46.8% and 28.3% respectively. The accuracy of the nomogram was affirmed by calibration curves, which showed high
consistency between actual observations and predictions (Figure 7D). These findings suggest that the
constructed risk prediction model not only effectively forecasts the survival prognosis of melanoma patients but also
holds substantial potential for clinical application due to its high predictive accuracy and consistency.
Figure 6. The validation of the prognostic model. The survival analysis results, risk score distribution, survival status, the expression of genes related to prognosis in the high and low risk groups, and AUC of all samples (A, D, G, J, M), training set (B, E, H, K, N), and test set (C, F, I, L, O).
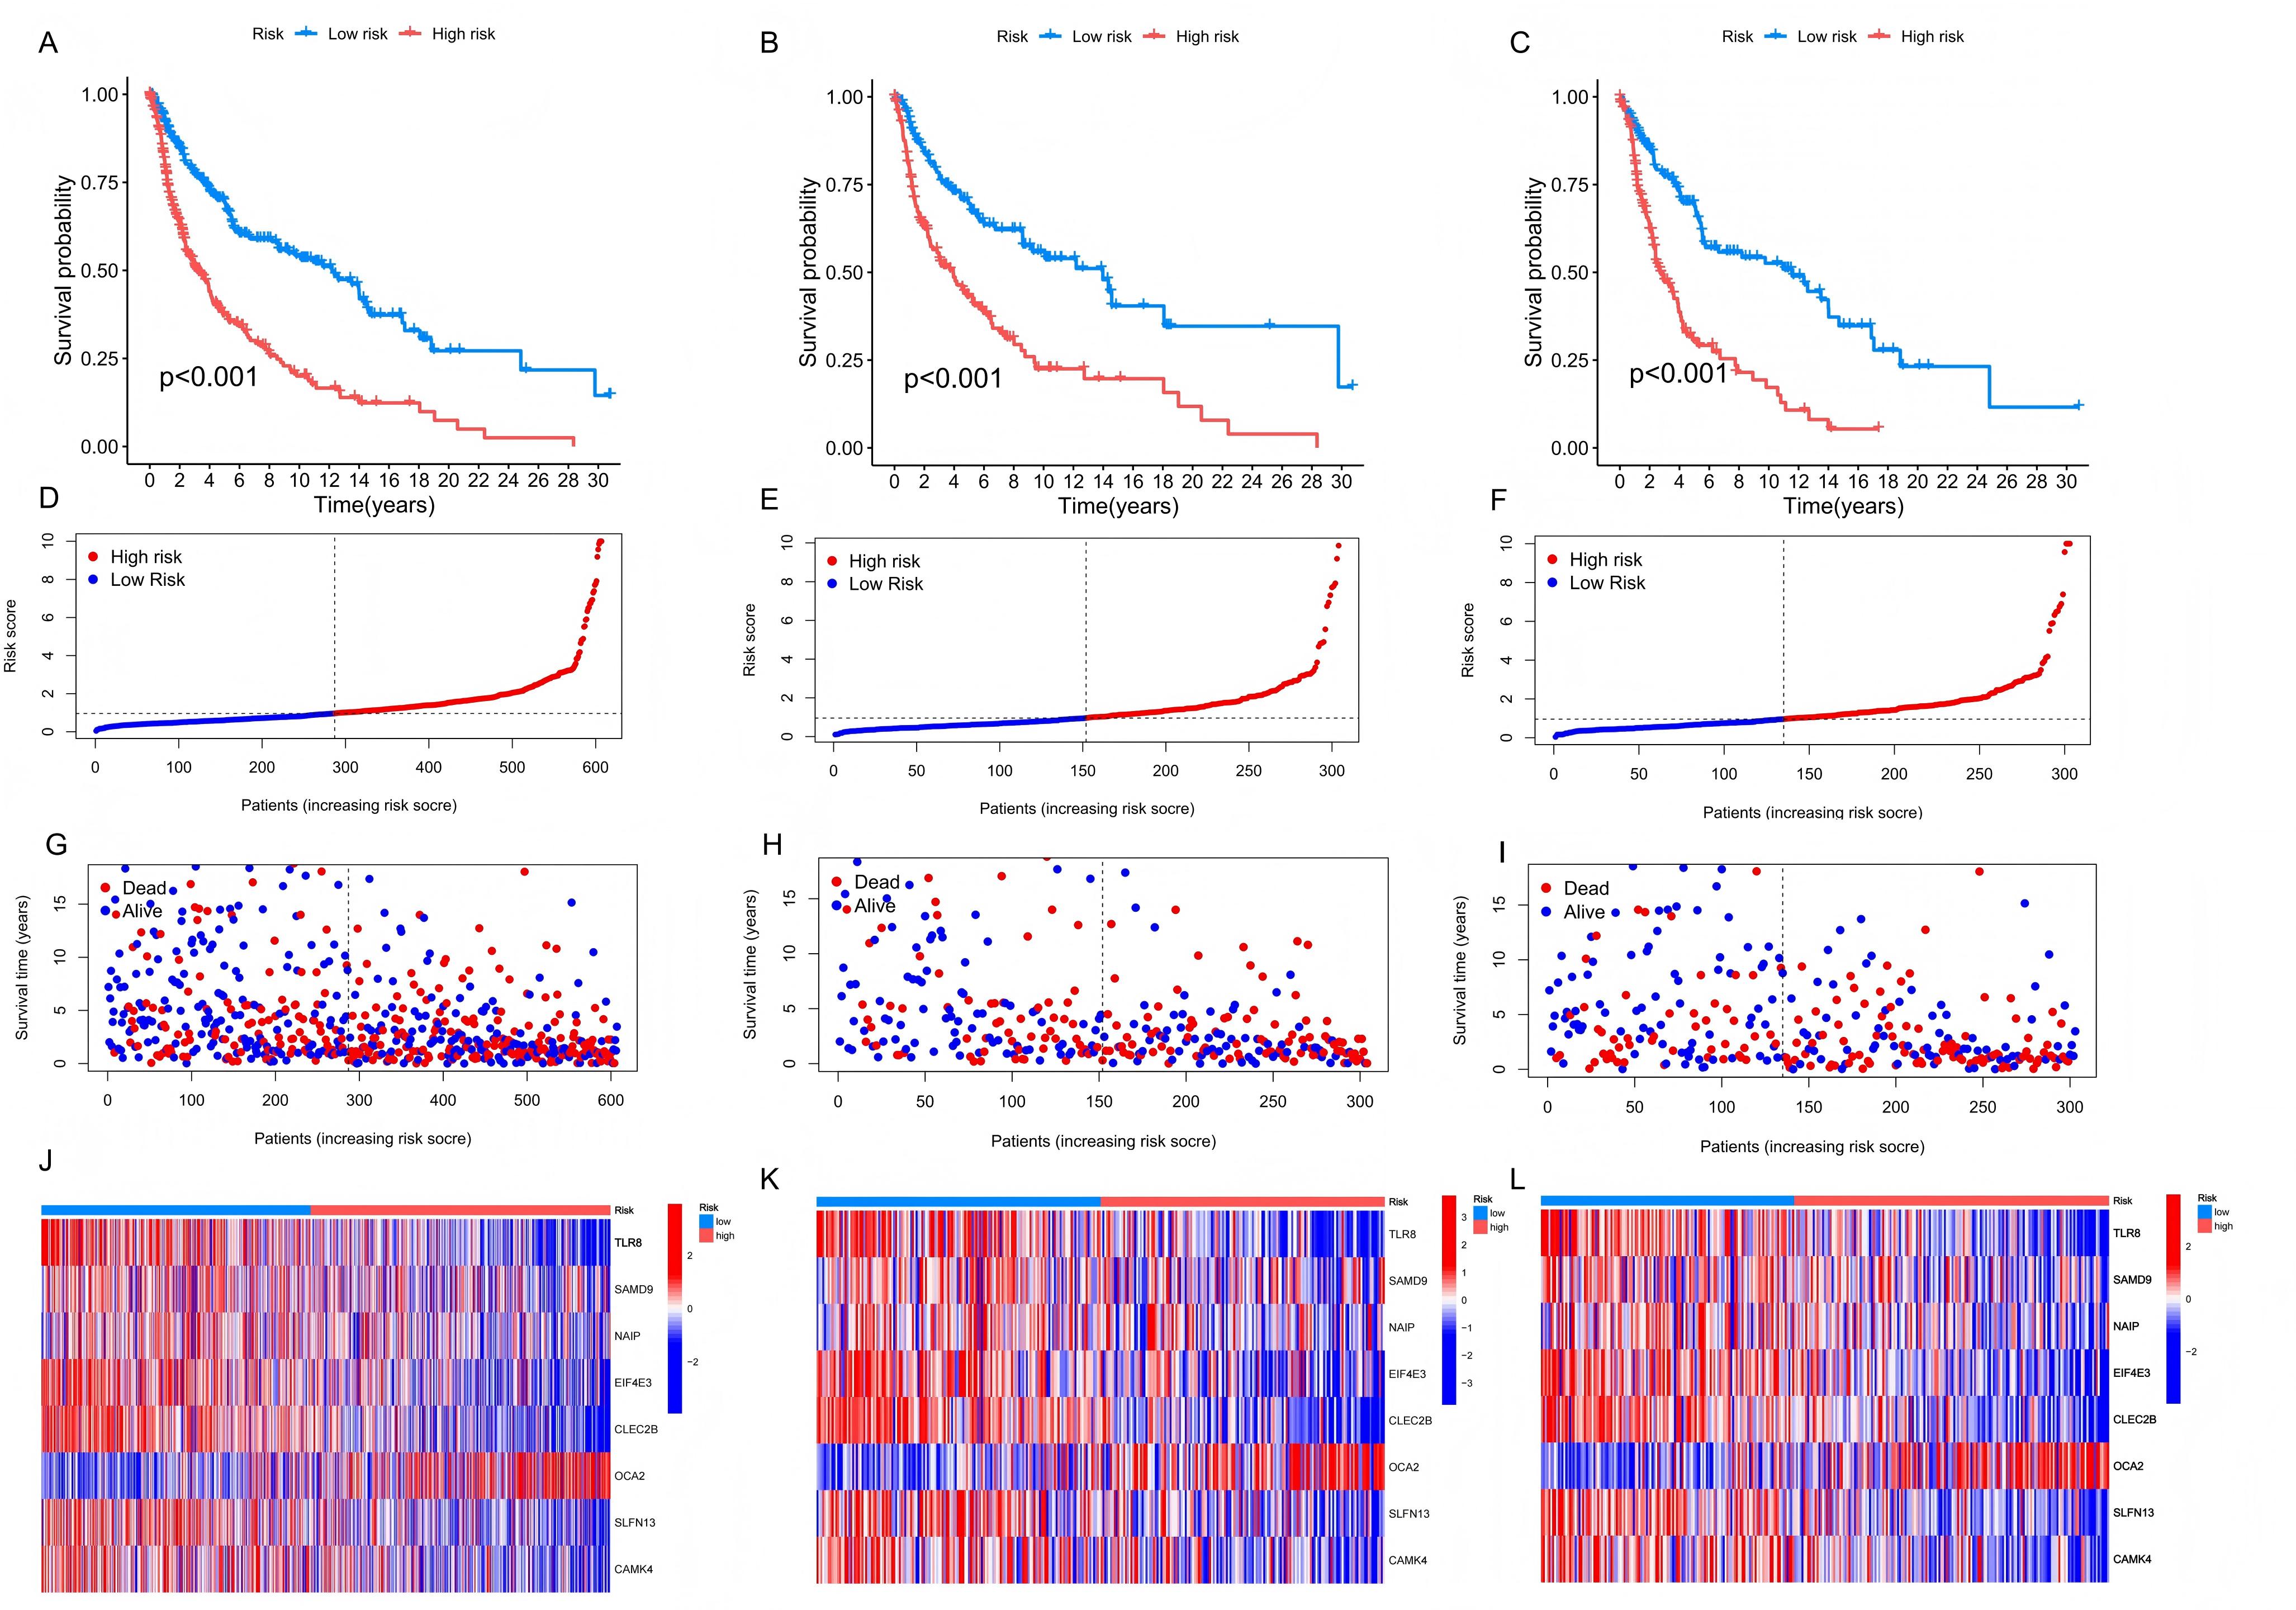
Figure 7.The clinical applicability of the prognostic model. (A-B) The results of univariate and multivariate Cox regression analysis prove that the risk score has independent predictive value. (C) The nomogram was used to calculate the survival rates of 1-, 3-, and 5-years for patients with melanoma. (D) Calibration curve for nomogram.
Analysis of immune microenvironment, TMB and TIDE
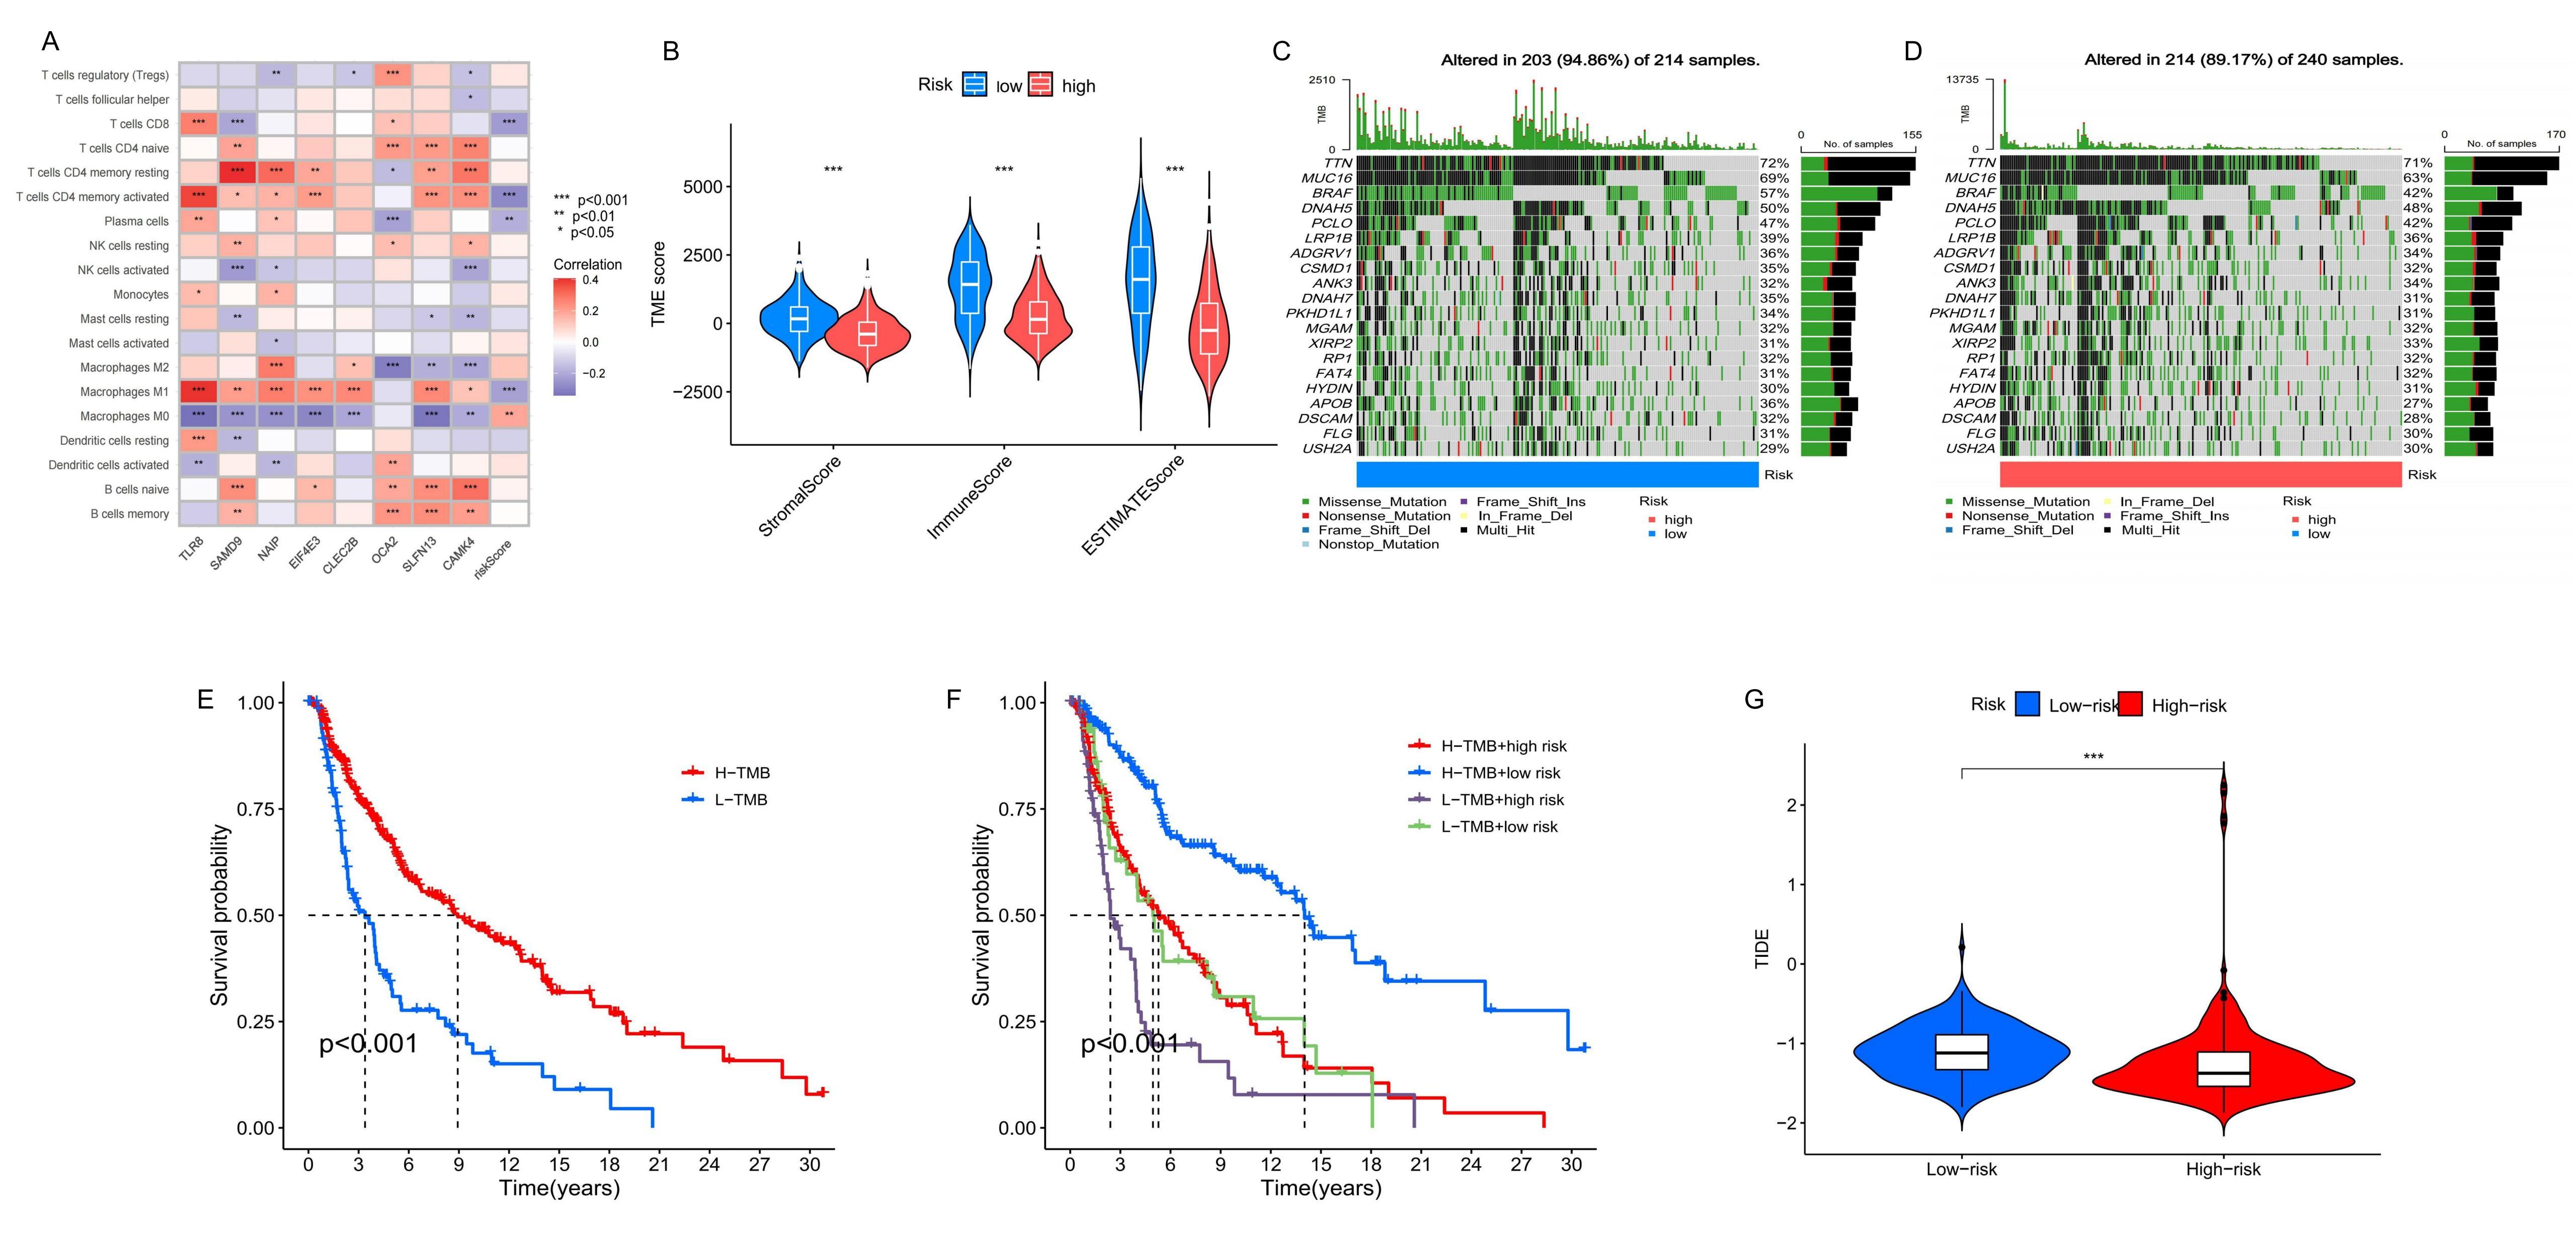
To understand the relationship between prognostic genes, risk scores, and immune cell infiltration, we utilized the
CIBERSORT algorithm (Figure 8A). The analysis revealed that higher risk scores were negatively
correlated with the infiltration of M1 macrophages, plasma cells, activated CD4 memory T cells, and CD8 T cells, but
positively correlated with M0 macrophages. This suggests that a higher risk score reflects a more immunosuppressive
TME. Further evaluation of immune, stromal, and estimate scores within the TME showed significantly higher scores in
the low-risk group compared to the high-risk group (Figure 8B). This indicated a more robust immune
presence in the low-risk group, underscoring the importance of the TME in patient prognosis. Immune checkpoint
blockade (ICB) therapy has shown substantial clinical benefits in treating melanoma; however, its effectiveness
varies, and some patients experience considerable side effects [24]. Recent studies have identified
TMB as a valuable predictor of tumor immune response, potentially indicating the efficacy of ICB therapy [22,25,26]. Quantitative TMB analysis revealed that the high-risk group had a
higher concentration of mutations across more genes than the low-risk group, which may correspond to a higher TMB (Figure 8C-D). K-M analysis further demonstrated that patients with high TMB had better survival probabilities than those with
low TMB. Moreover, integrating risk model predictions, we found that the highest long-term survival probability was
observed in patients with high TMB and low-risk scores, whereas the lowest was in those with low TMB and high-risk
scores (Figure 8E-F). Additionally, we obtained immunotherapy scores for patient samples from the
TIDE website and conducted a matching analysis with our prognostic model, calculating TIDE scores for the two groups.
The results showed significant differences in TIDE scores, with higher scores observed in the low-risk group compared
to the high-risk group (Figure 8G). When combined with the TMB analysis, these results suggested
that patients in the high-risk group may have a more active response to immunotherapy.
Figure 8. Comparison of TME and TMB between high-risk and low-risk groups. (A) The correlation between the number of immune cells infiltrated and the eight prognostic signatures and risk score. (B) The TME scores of high-risk and low-risk group. (C-D) The TMB of high-risk and low-risk group. (E-F) K-M survival analysis based on TMB. (G) The TIDE scores of two groups.
Drug sensitivity analysis
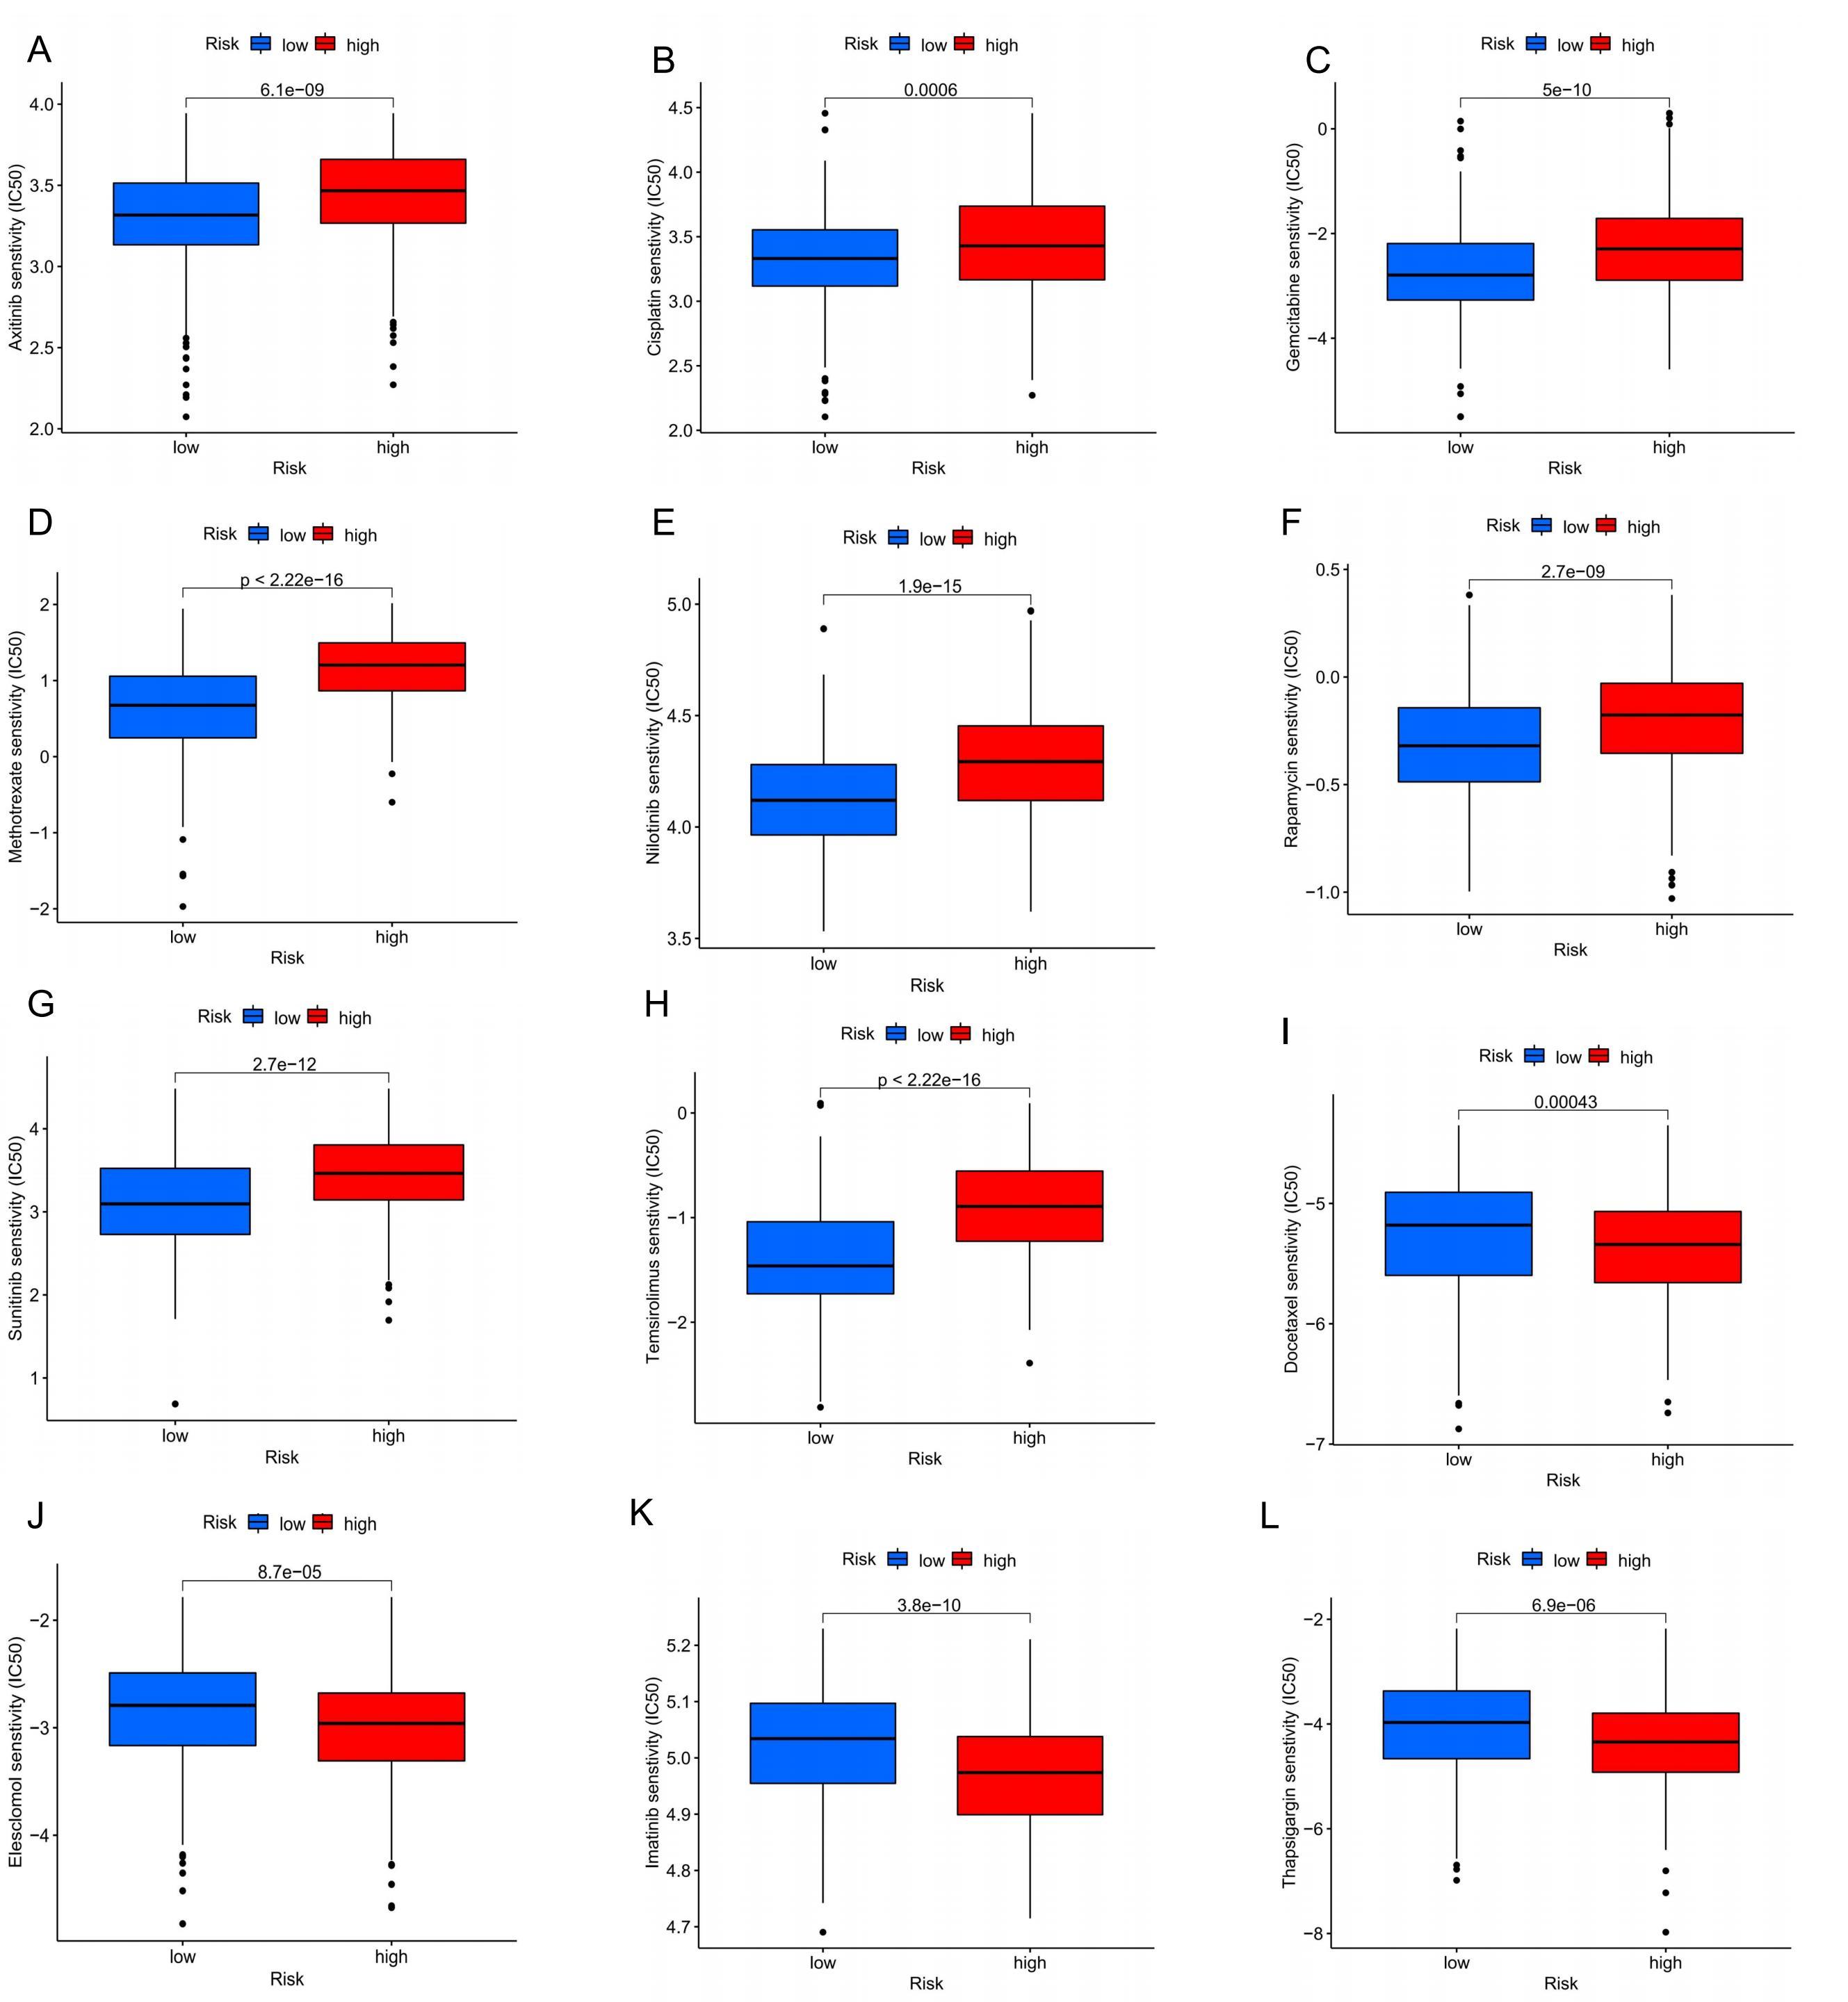
To enhance the clinical utility of our prognostic model and improve treatment efficacy, we compared the drug
sensitivity between the high-risk and low-risk groups to identify potential drugs for more effective immune or
targeted therapies. The analysis of half-maximal inhibitory concentration (IC50) for various drugs revealed
significant differences between the two groups. The low-risk group demonstrated greater sensitivity to several
immunotherapeutic and targeted drugs, including Axitinib, Cisplatin, Gemcitabine, Methotrexate, Nilotinib, Rapamycin,
Sunitinib, and Temsirolimus (Figure 9A-H). Conversely, the high-risk group exhibited higher
sensitivity to drugs such as Docetaxel, Elesclomol, Imatinib, and Thapsigargin (Figure 9I-L). These
findings provided valuable insights into tailoring treatment strategies based on the risk profile, potentially leading
to more effective therapeutic interventions for patients.
Figure 9. Comparison of sensitivity to chemotherapy or targeted therapy between high-risk and low-risk groups of melanoma patients. (A) Axitinib; (B) Cisplatin; (C) Gemcitabine; (D) Methotrexate; (E) Nilotinib; (F) Rapamycin; (G) Sunitinib; (H) Temsirolimus; (I) Docetaxel; (J) Elesclomol; (K) Imatinib; (L) Thapsigargin.
Discussion
Melanoma, the most prevalent and deadly form of skin cancer, often goes undetected in its early stages due to non-obvious symptoms, leading to diagnoses at more advanced stages with metastatic lesions and consequently poor prognoses [27,28]. While the development and application of immunotherapy and targeted therapies, such as BRAF inhibitors, BRAF/MEK combination targeted therapy, and PD-1/PD-L1/CTLA-4 blockers, have significantly improved outcomes for many patients, resistance to these therapies frequently develops through mutations that promote irreversible drug resistance [10,29,30].
The progression of tumor cells is primarily driven by accumulations of gene mutations, which lead to uncontrolled cell proliferation [31]. A critical aspect of many cancers, including melanoma, is the activation of the MAPK pathway, which stimulates growth-promoting genes, leading to anchoring loss and inhibition of intercellular contact, resulting in uncontrolled cell proliferation and transformation [1,32].Normally, cells can initiate various regulated cell death (RCD) mechanisms to maintain cellular homeostasis, including necroptosis, pyroptosis, ferroptosis, autophagic cell death, programmed cell death and apoptosis [33]. In addition, a novel form of cell death termed cuproptosis, characterized by copper-induced cell death, has been identified [17]. The research showed that excessive copper accumulates in cells and directly combines with the lipoylated components of the TCA, leading to the aggregation of lipoylated proteins and the loss of Fe-S cluster proteins, which in turn leads to protein toxicity stress and eventually leads to cell death. And they proved that FDX1 (a cuproptosis related gene) was involved in regulating the lipoylation of proteins. In addition, the analysis of cancer dependency graph showed that the expression of FDX1 was positively correlated with the level of lipoic acid in tumor tissue, and the deletion of FDX1 could inhibit the lipoylation of dihydrolipoamide S-acetyltransferase (DLAT) (an enzyme in TCA). This showed that the new field of cuproptosis may provide a new perspective to develop therapeutic targets for cancer treatment.
In this study, we categorized melanoma samples into three distinct cuproptosis-related subtypes based on the expression profiles of 18 CRGs. Survival analysis revealed significant prognostic differences among these subtypes. Further analysis identified DEGs associated with these subtypes that were involved in cytotoxic production, immune response regulation, and various signaling pathways such as PI3K-Akt, potentially impacting tumor cell metabolism and evasion of immune surveillance. potentially impacting tumor cell metabolism and evasion of immune surveillance. Our research focused on the CRG clusters related DEGs, and through algorithm simulation, we obtained eight significant prognostic signatures and established a prognostic model. Previous studies have established prognostic models for bladder cancer, prostate cancer, hepatocellular carcinoma, and other diseases and shown good predictive ability [34-36]. And we also verified the performance of our prognostic models through survival analysis, ROC curve and independent prognostic analysis, etc. The results indicated that our prognostic model has the ability to group patients according to the risk score and predict the prognosis of patients.
The eight screened-out DEGs related to CRG clusters are CAMK4, TLR8, EIF4E3, CLEC2B, OCA2, SLFN13, SAMD9 and NAIP. Notably, research by Li et al. demonstrated that microRNA-129-5p targeted calmodulin-dependent protein kinase IV (CAMK4) to inhibit the proliferation, migration, and invasion of hepatocytes, suggesting that CAMK4 could mitigate cancer progression by inhibiting the MAPK pathway [37]—a key promoter of tumor growth and angiogenesis. This finding indicated that CAMK4 may be a promising target for melanoma, especially since current treatments like Vemurafenib and Trametinib target the MAPK pathway to control disease progression [10]. Toll-like receptors (TLRs), critical to innate immunity, are garnering attention in immunotherapy. With the development of immunotherapy, the TLRs family has also been paid more and more attention. Motolimod, a TLR8 agonist, has shown potential in preclinical models, underscoring the relevance of the TLRs in cancer treatment, particularly as resistance to existing therapies increases [38]. With the targeting and immune therapy of melanoma, drug resistance is gradually increasing. The development or combination of new drugs may improve the therapeutic effect. Another noteworthy gene, EIF4E3, part of the EIF4E family, acts as a tissue-specific tumor suppressor by binding to the methyl-7-guanosine cap, thus preventing carcinogenic transformation [39]. CLEC2B, a marker identified in various cancers and linked to immune response regulation [40], has been shown to act as a protective factor in melanoma [41]. This suggested its potential utility as a therapeutic target, possibly enhancing immune response against tumor cells. The Schlafen (SLFN) gene family, associated with immune cell differentiation and regulation, showed varied impacts across different cancers. For example, high SLFN13 expression correlated with poor prognosis in gastric cancer [42], yet appeared as a low-risk factor in our melanoma studies, potentially due to epigenetic modifications. This indicated the complex role of SLFN genes in cancer and the need for further investigation. OCA2, associated with pigmentation, has been linked to an increased risk of familial melanoma [43] and cutaneous squamous cell carcinoma [44]. This suggested its role in melanoma progression and potential as a therapeutic target. SAMD9 mutations were implicated in various diseases, including myelodysplastic syndrome (MDS), esophageal cancer, and lung cancer. Research indicated that SAMD9 suppression could slow glioblastoma progression, highlighting its role in cancer development and as a potential therapeutic target [45,46]. Lastly, the neuronal apoptosis inhibitor protein (NAIP), part of the inhibitor of apoptosis protein (IAP) family, was known to suppress apoptosis. Research by Yang et al. showed that tumor suppressor p53 regulates miR-15a to reduce NAIP expression, thereby enhancing apoptosis in breast cancer cells. This finding aligns with earlier studies suggesting that increasing IAP expression can re-sensitize cancer cells to apoptotic signals, offering new avenues for cancer therapy. This highlighted the potential of targeting IAP pathways, including NAIP, as a strategy for inducing cancer cell apoptosis and improving therapeutic outcomes [47-49]. These findings collectively underscored the potential of these genes as targets for melanoma treatment, necessitating further studies to fully understand their roles and therapeutic potential in the tumor microenvironment and beyond.
TME consists of tumor cells, immune cells, and cytokines, forming an ecosystem that plays a critical role in tumor development, growth, and metastasis [50]. With the advancement of ICB therapies, the study of immune cells, cytokines, and immune mechanisms within the TME has deepened [51]. In our study, we observed a significant negative correlation between risk scores and the infiltration levels of CD8+ T cells, activated memory CD4+ T cells, M1 macrophages, and plasma cells. Macrophages can be polarized into two types based on their phenotype and secreted cytokines: M1 and M2. M1 macrophages secrete tumor-killing agents such as reactive oxygen species, nitric oxide, IFN-γ, and Fas ligand (FasL), and they also recruit other tumor-specific immune cells through chemokine secretion, playing a key role in anti-tumor responses [52]. Similarly, activated memory CD4+ T helper (Th1) cells and CD8+ T cells are crucial for establishing long-term immune memory, which triggers a rapid cytotoxic response upon re-exposure to tumor cells. These immune cells are essential for the long-term remission of melanoma [53,54]. A disruption in the balance between tumor cells and the host immune response may lead to the progression of melanoma, contributing to the poorer prognosis seen in high-risk groups. These observations are critical for understanding the molecular underpinnings that differentiate prognostic outcomes in melanoma, providing a basis for targeted therapeutic interventions.
In addition, we evaluated the TME of the high-risk and low-risk groups based on the ESTIMATE algorithm. The results showed that the stromal, immune, and ESTIMATE scores were significantly higher in the low-risk group compared to the high-risk group, suggesting that the low-risk group had better immune defense and response capabilities. However, contrary to our expectations, the TIDE score for the low-risk group was higher, indicating a greater likelihood of immune escape in this group. This apparent paradox underscores the complex and dual-nature role of immune responses in melanoma progression. Melanoma is widely recognized for its high immunogenicity, often generating a substantial number of neoantigens through mechanisms such as chromosomal instability, high mutation burden, and structural variants. These tumor-specific antigens can initiate potent innate and adaptive immune reactions, recruiting lymphocytes and other immune mediators into the tumor bed, which is reflected in the high immune scores observed.However, the very intensity of this immune pressure drives the selection of tumor clones capable of exploiting regulatory pathways to evade destruction. Melanoma cells can engage a variety of resistance mechanisms, including the upregulation of immune checkpoint molecules (e.g., PD-L1, CTLA-4), recruitment of immunosuppressive cells (such as Tregs, MDSCs, or M2 macrophages), and secretion of soluble factors that dampen T-cell function. Therefore, an immune-rich microenvironment may not always correlate with productive cytotoxicity; rather, it can represent a battlefield where immune activation and suppression coexist dynamically. The elevated TIDE score in the context of high immune infiltration may thus reflect this dysfunctional state—a TME characterized by abundant but exhausted or inhibited lymphocytes, and active mechanisms of adaptive immune resistance.In summary, the coexistence of high immune scores and high TIDE scores in the low-risk group illuminates the intricate and often contradictory nature of tumor–immune interactions. It suggests that the low-risk group may be dominated by an “immune-inflamed” but poorly effective phenotype, where the immune response is actively suppressed by escape mechanisms. This insight emphasizes the necessity of combining prognostic signatures with functional biomarkers of immune competence to more accurately stratify patients and tailor immunotherapeutic strategies. [52].
Despite these findings, our study has some limitations. First, the relationship between CRGs and melanoma development remains unclear and warrants further investigation. Additionally, our analysis is based on retrospective clinical samples, and further prospective studies are needed to validate the clinical utility of our prognostic model.
Conclusion
In conclusion, we identified eight prognostic signatures from differentially expressed genes associated with CRG clusters and developed a prognostic model for melanoma patients. This model offers valuable insights into the immune landscape, prognosis, and potential clinical treatment options, serving as a useful reference for guiding personalized melanoma therapies.
Abbreviations
Area under the curve: AUC; Biological Process: BP; Calmod-ulin-dependent protein kinase IV: CAMK4; Cuproptosis-related genes: CRGs; Cytotoxic T lymphocyte antigen 4: CTLA4; Copy number variation: CNV; Differentially expressed genes: DEGs; Fas ligand: FasL; Gene set variation analysis: GSVA; Gene Expression Omnibus: GEO; Genomics of Drug Sensitivity in Cancer: GDSC; Immune checkpoint blockade: ICB; Inhibitor of apoptosis protein: IAP; Half-maximal inhibitory concentration: IC50; Kaplan-Meier: K-M; Least absolute shrinkage and selec-tion operator: LASSO; Molecular Function: MF; Myelodysplas-tic syndrome: MDS; Neuronal apoptosis inhibitor protein: NAIP; Principal component analysis: PCA; Regulated cell death: RCD; Receiver operating characteristic: ROC; Single sample gene-set enrichment analysis: ssGSEA; The Cancer Genome Atlas: TCGA; Tricarboxylic acid: TCA; Tumor microenvironment: TME; Tumor mutation burden: TMB; Tumor immune dysfunction and exclusion: TIDE; Toll-like receptors: TLRs; T helper cell 1: Th1
Supplementary Materials
Declarations
Author contributions
Zishen Xia, Nan Gao and Jianwen Wang contributed equally to this work as co-first authors, participating in data curation, formal analysis, methodology development, software imple-mentation, visualization, and manuscript writing. Lizhao Yan, Cong Ma, and Kangwei Wang were responsible for reviewing the conceptual design, writing the article, and proofreading. Yuxiong Weng conceived the study, overseeing the study de-sign, writing, data acquisition, analysis, and interpretation. All authors read and approved the final manuscript.
Acknowledgements
Not Applicable
Funding information
None.
Ethics approval and consent to participate
Not Applicable.
Competing Interests
The authors declare that they have no existing or potential commercial or financial relationships that could create a con-flict of interest at the time of conducting this study.
Data availability
The data that support the findings of this study are available in the following repositories: TCGA [http://cancergenome.nih.gov], GEO: [https://www.ncbi.nlm.nih.gov/geo], TIDE [http://tide.dfci.harvard.edu], GDSC [https://www.cancerrxgene.org]. These data were derived from resources available in the public domain and are freely accessible under their respective usage guidelines.
References
 Figures
 References
 Peer
Peer Information
Figure 1. Genomic variation of CRG. (A) The change of CNV frequency of CRGs. (B) CRG position of CNV on the chromosome. (C) The interaction between CRGs in melanoma, where the width of the line represents the strength of the correlation between CRGs.
Figure 2. Identification and analysis of the CRG clusters. (A) Unsupervised consensus clustering identified three molecular subtypes of cuproptosis. (B) The PCA results show the distribution of the three CRG clusters. (C) It shows the differential expression of CRG among the three CRG clusters and different clinical features. (D) The K-M survival analysis of the 3 CRG clusters. (E) The immune infiltration difference of TME in the three clusters.
Figure 3. GO and KEGG analysis of the CRG clusters related DEGs. (A) Intersection DEGs of three CRG clusters. (B-C) Visualization of GO and KEGG analysis results.
Figure 4. Age distribution of the searches for 12 topics regarding mental illness from 8 December 2019 to 9 March 2020.Identification and analysis of the DEG clusters. (A) Unsupervised consensus clustering identified two DEG clusters. (B) The K-M survival analysis of the DEG clusters. (C) The clinical characteristics and cuproptosis subtypes differences between the two DEG subtypes. (D) The differences in CRG expression between the two DEG clusters.
Figure 5.Construction of the prognostic model. (A-B) LASSO regression analysis screened prognostic signatures from the DEGs to build the model. (C) The relationship among CRG clusters, DEG clusters, risk groups and survival status. (D) Distribution of risk scores across the three CRG clusters. (E) Distribution of risk scores across the two DEG clusters. (F) Comparison of CRG expression between the high-risk group and low-risk group.
Figure 6. The validation of the prognostic model. The survival analysis results, risk score distribution, survival status, the expression of genes related to prognosis in the high and low risk groups, and AUC of all samples (A, D, G, J, M), training set (B, E, H, K, N), and test set (C, F, I, L, O).
Figure 7.The clinical applicability of the prognostic model. (A-B) The results of univariate and multivariate Cox regression analysis prove that the risk score has independent predictive value. (C) The nomogram was used to calculate the survival rates of 1-, 3-, and 5-years for patients with melanoma. (D) Calibration curve for nomogram.
Figure 8. Comparison of TME and TMB between high-risk and low-risk groups. (A) The correlation between the number of immune cells infiltrated and the eight prognostic signatures and risk score. (B) The TME scores of high-risk and low-risk group. (C-D) The TMB of high-risk and low-risk group. (E-F) K-M survival analysis based on TMB. (G) The TIDE scores of two groups.
Figure 9. Comparison of sensitivity to chemotherapy or targeted therapy between high-risk and low-risk groups of melanoma patients. (A) Axitinib; (B) Cisplatin; (C) Gemcitabine; (D) Methotrexate; (E) Nilotinib; (F) Rapamycin; (G) Sunitinib; (H) Temsirolimus; (I) Docetaxel; (J) Elesclomol; (K) Imatinib; (L) Thapsigargin.
Peer-review Terminology
Identity transparency: Single anonymized
Reviewer interacts with: Editor
Details
This is an open access article under the terms of the Creative Commons Attribution License(http://creativecommons.org/licenses/by/4.0/), which permits use, distribution and reproduction in any medium, provided the original work is properly cited.
Publication History
Received 2025-04-22
Accepted 2025-08-30
Published 2025-10-13